
2023
Constant
Companion:
A Week in the Life of a Young Person's
Smartphone Use
Constant Companion:
A Week in the Life of a Young Person's
Smartphone Use

COMMON SENSE IS GRATEFUL FOR THE GENEROUS SUPPORT AND
UNDERWRITING THAT FUNDED THIS RESEARCH REPORT
Bezos Family Foundation
Jennifer Caldwell and John H.N. Fisher
Carnegie Corporation of New York
Margaret and Will Hearst

A Letter from Our Founder
Smartphones have become a constant companion in our teens' lives. From connection
with family and friends to entertainment and background noise, young people rely on their
smartphones for different types of mental health support, relaxation, and distraction—at
home and at school, and during the day and night.
This year, Common Sense has focused our research efforts on hearing directly from young
people about both the role and the impact of media and technology in their lives. This
report fills a gap in our understanding of how teens actually use their smartphones,
combining data from kids' phones themselves with feedback from our Youth Advisory
Council. And they told us that the draw of their smartphone is both complicated and
powerful. Here's what else we learned from this report:
• Teens are fielding a barrage of notifications from the apps on their phones. On a
typical day, participants received a median of 237 notifications. Of those, about a
quarter arrived during the school day, and 5% at night.
• School phone use is common, and policies are inconsistent. During school hours
almost all of the participants used their phones at least once, for a median of 43
minutes. But they also reported that policies about phone use in schools vary—some-
times even from classroom to classroom—and aren't always enforced.
• Smartphones both help and hurt sleep. Over half of participants used their phones on
school nights, often to listen to music to wind down or get to sleep. But sometimes
their days are so busy that they only get to relax with their phone at bedtime, and that
pushes sleep later.
The good news is, many young people reported they have grown savvier about their
phone's attempts to draw them in, and they're taking steps to protect their digital well-
being, like setting time limits and prioritizing certain types of notifications. But the
business model of these apps and devices hinges upon young people picking up their
phones and engaging with them as much as possible, and it's clear that teens are struggling
to set boundaries.
Research like this helps shed light on what young people are really doing on their phones,
and allows families, educators, and leaders to better understand where and when to
provide support. But the industry can take steps to recognize that young people need to
be able to use their phones for all of their important benefits but without the challenges
that negative content, persuasive design, and aggressive business models pose to digital
well-being.
At Common Sense, we will continue to provide parents, caregivers, educators, industry
leaders, and policymakers with the tools, resources, research, and information they need
to help kids build healthier relationships with the technology in their lives. And it's our
hope that this research allows for continued focus on youth voices in our mission to make
the digital world work better for kids everywhere.
James P. Steyer,
Founder and CEO

Suggested citation: Radesky, J., Weeks, H.M., Schaller, A., Robb, M., Mann, S., and Lenhart, A. (2023). Constant Companion: A Week in the Life of a Young Person's
Smartphone Use. San Francisco, CA: Common Sense.
Credits
Authors: Jenny S. Radesky, M.D., Department of Pediatrics, University of Michigan Medical School
Heidi M. Weeks, Ph.D., Department of Nutritional Sciences, University of Michigan School
of Public Health
Alexandria Schaller, B.A., Department of Pediatrics, University of Michigan Medical School
Michael B. Robb, Ph.D., Former Head of Research, Common Sense Media
Supreet Mann, Ph.D., Director of Research, Common Sense Media
Amanda Lenhart, M.A., Head of Research, Common Sense Media
Copy editors: Christopher Dare and Jennifer Robb
Designers: Emely Garcia and Chris Arth
Acknowledgments: This research was supported by Common Sense Media. We thank Candice Odgers
for consultative assistance with survey measures. We also thank Andy Chen for
assistance collecting app store data.
Table of Contents
Introduction . . . . . . . . . . . . . . . . . . . . . . . . . . . . . . . . . . . . . . . . . . . . 1
Key Findings . . . . . . . . . . . . . . . . . . . . . . . . . . . . . . . . . . . . . . . . . . . . 3
Methodology . . . . . . . . . . . . . . . . . . . . . . . . . . . . . . . . . . . . . . . . . . . 11
Main Findings . . . . . . . . . . . . . . . . . . . . . . . . . . . . . . . . . . . . . . . . . . . 14
Discussion . . . . . . . . . . . . . . . . . . . . . . . . . . . . . . . . . . . . . . . . . . . . . 50
References. . . . . . . . . . . . . . . . . . . . . . . . . . . . . . . . . . . . . . . . . . . . . 52
Supplemental Tables . . . . . . . . . . . . . . . . . . . . . . . . . . . . . . . . . . . . . . 54
1 CONSTANT COMPANION: A WEEK IN THE LIFE OF A YOUNG PERSON'S SMARTPHONE USE © COMMON SENSE MEDIA. ALL RIGHTS RESERVED.
Smartphones entered the lives of children and adolescents in
2007. Compared to earlier devices (flip phones), smartphones
allowed more than just texting and taking photos. Young
people could now browse the internet, choose from thou-
sands of mobile applications ("apps") and games, and connect
immediately with their communities through social plat-
forms—from anywhere.
As internet speeds and computing power increased exponen-
tially over the past 15 years, smartphones have become even
more powerful and versatile, allowing livestreaming, multi-
player gaming, and creation and distribution of content. Over
a relatively short period of time, these handheld computers
have become a disruptive force in the lives of young people, in
positive and negative ways that adults who grew up with land-
lines may not fully grasp.
Getting a smartphone is now a rite of passage for most chil-
dren and adolescents in the United States. According to
Common Sense Research, 43% of tweens (age 8 to 12) and
88% to 95% of teens (age 13 to 18) have their own smartphone
(Rideout et al., 2022; Pew 2022). About half of U.S. children
get their first smartphone by age 11 (Rideout et al., 2022).
Young people describe a range of supportive and stressful
experiences with their smartphones—some wish they hadn't
gotten one so early, while also describing it as an appendage
that they cannot live without (Moreno et al., 2019). The deci-
sion of when to get a smartphone, and negotiations about
rules and boundaries around smartphone use, are frequent
sources of parental stress and family arguments (Mathes et al.,
2021; Francis et al., 2021; Hiniker, Schoenebeck, & Kientz,
2016).
Several factors contribute to young people's attachment to
their phones. First, it is developmentally appropriate for ado-
lescents to seek connection and feedback from their friends
and communities, and to want to do so on a frequent basis.
Children and adolescents have developmentally adaptive
curiosity about information, culture, entertainment, and
stories that help them make sense of their world.
However, the design and marketing choices made by technol-
ogy companies to meet their business objectives also make it
challenging for young users to separate from their smart-
phones. More time spent on mobile apps translates to more
advertising revenue and in-app purchases, so many apps
contain persuasive design features to encourage prolonged
engagement (Radesky et al., 2022; 5 Rights Foundation,
2021). These design features include encouragement of
content creation (so there is always more content to recom-
mend to users), reduction of friction (e.g., the swipe-up
movement that allows a user to easily move on to another
video), time pressure (e.g., notifications urging users to watch
a livestream before it stops), quantified reinforcers (e.g., likes,
shares, virtual currency), or algorithmic recommendations
that analyze a user's digital behavior to predict what they
might click on next.
Underlying these design features are marketing incentives to
keep young people on their phones—and ideally win their
brand alliance. Smartphones are an unprecedented marketing
vehicle because they are taken everywhere and provide
insight into users' daily behavior, preferences, and social net-
works. The data traces recorded by smartphones (such as
location, purchases, likes, and shares) allow businesses to
create user profiles, which can then be sold or used to earn
revenue through targeted advertising.
Considering the competing interests of 1) a business model
that prioritizes engagement and 2) a developing adolescent
human user with various passions, drives, and obligations, it is
not surprising that both young people and their parents com-
plain of feeling like they spend more time on their phones than
they intend (Pew 2022; James & Weinstein, 2022).
Smartphones are nearly ubiquitous in the life of U.S. adoles-
cents, but research on how they are used has been elusive.
This research typically relies on self-reporting of daily usage
habits, momentary reports (e.g., pinging participants through-
out their day to assess moment-to-moment changes in media
use), or asking young users what they experience through
their phones (e.g., social support or bullying; toxic or inspira-
tional content). However, if we want to interrogate the role of
Introduction
CONSTANT COMPANION: A WEEK IN THE LIFE OF A YOUNG PERSON'S SMARTPHONE USE 2© COMMON SENSE MEDIA. ALL RIGHTS RESERVED.
To that end, we enrolled 203 11- to 17-year-olds in the United
States to let us track their smartphone use for one week by
installing Chronicle, a study app (Radesky et al., 2020). This
app runs unobtrusively in the background and provides con-
tinuous data about which apps were used and when, how
many pickups and notifications occurred, and how much
smartphones were used during the school day and overnight
hours. The study was conducted with Android phone users
only, because Apple device tracking does not share with the
research community the names of specific non-Apple apps
that young people commonly use (e.g., social media apps,
mobile games).
After analyzing results, we reviewed them with 15 members
of the 2023 Common Sense Youth Advisory Council, a group
of 14- to 18-year-olds of various races/ethnicities and genders
who live in communities across the United States. These youth
advisors worked with Common Sense from January to May
2023, but their phones were not tracked as part of the study.
Through these conversations, we gained insights into the push
and pull that adolescents feel with their phones, with the ulti-
mate goal of imagining how smartphones could be designed to
support the agency of younger users.
Along with our main findings, this report includes relevant and
actionable takeaways for parents and policymakers, as well as
discussion prompts for talking with kids about their some-
times complicated relationships with smartphones.
smartphones—and all of their complex uses in the daily lives of
young people, from communication to entertainment, creativ-
ity, marketing, and productivity—then we need research
methods that measure the behavior of phones. This is possible
through the harnessing of data that is already collected by
technology companies and marketing firms to monitor smart-
phone users, but that is not typically shared with researchers
on an individual-user basis.
For this study, we used software to collect data from the
smartphones of a diverse sample of about 200 11- to 17-year-
olds. We then interpreted this data with assistance from an
advisory council of young people to understand the nuanced
relationships that young people develop with their
smartphones.
Our research aimed to address the following questions:
• How much time are preadolescents and adolescents
spending on their smartphones?
• Which types of apps do they use most frequently and for
the longest periods of time, and why?
• Are they accessing apps intended for older audiences?
• How many notifications are they receiving per day, and
from which apps?
• How much smartphone use occurs during school hours,
and why?
• How much smartphone use occurs at night, and why?
• How much tension or frustration are preadolescents and
adolescents experiencing about their smartphones, and
how do they manage this?
• Are there new insights about youth experiences and
practices with smartphones that could lead to better
design to improve young people's well-being?
3 CONSTANT COMPANION: A WEEK IN THE LIFE OF A YOUNG PERSON'S SMARTPHONE USE © COMMON SENSE MEDIA. ALL RIGHTS RESERVED.
Key Findings
The key findings in this report combine
granular data about young people's smart-
phone use with teens' own interpretation of
the role that these devices play in their lives.
This unique perspective gives us a glimpse
into teens' relationships with their devices,
including the attraction that smartphones
and apps hold for teens, the corresponding
pressures, and the strategies they use
(whether barriers, rules, or friction) to
manage smartphone use in their day-to-day
experiences.
1. The smartphone is a constant
companion, both providing background
buzz and encouraging regular pickups
over the more than four hours of teen
smartphone use on an average day.
Smartphones are integrated into young people's lives in ways
that help them connect with friends, give their brain a rest, or
help them laugh and calm down during their busy days. On a
typical day, the participants in our study used their smart-
phones for a median of almost four and a half hours. However,
simply showing average daily smartphone duration across our
sample doesn't tell the whole story. Some participants used
their phones for only a few minutes per day, while others aver-
aged over 16 hours a day (Figure 1).
Adolescents' smartphone use doesn't always match adults'
narrative of "teens always staring at their screens." In addition
to more active use, some teens in our focus groups talked
about how they also use their smartphones to provide a back-
ground "buzz" by playing movies, videos, or music while they
do homework or laundry.
And for most of the teens in our sample, their smartphones
were close at hand and picked up and checked frequently
throughout the day—a median of 51 times per day, ranging
from two to 498 times per day. Younger participants (11- to
12-year-olds) tended to pick up their phones less frequently
each day, while adolescents (age 13 and older) were more
likely to check their phone over 100 times per day (Figure 2).
Teens in our focus groups told us that younger smartphone
users usually have more rules or restrictions placed on their
use, while older teens are given more independence as they
learn the appropriate time and place to use their phone.
Younger teens may be less likely to have peers with smart-
phones, and fewer friends to contact.
CONSTANT COMPANION: A WEEK IN THE LIFE OF A YOUNG PERSON'S SMARTPHONE USE 4© COMMON SENSE MEDIA. ALL RIGHTS RESERVED.
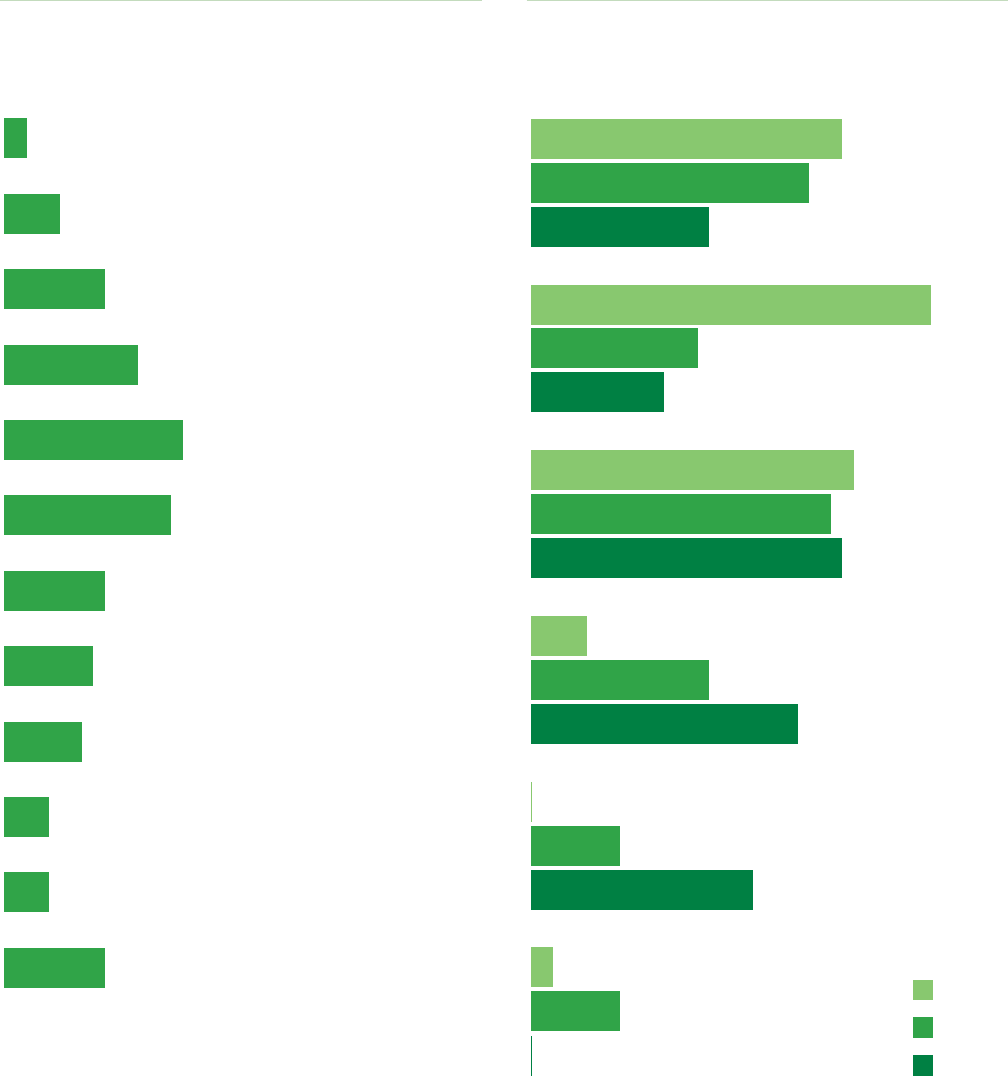
FIGURE 1. Distribution of average daily duration of
smartphone use
>10 hours
9-10 hours
8-9 hours
7-8 hours
6-7 hours
5-6 hours
4-5 hours
3-4 hours
2-3 hours
1-2 hours
30-60 min
0-30 min
9%
5%
2%
12%
16%
15%
9%
8%
7%
4%
4%
9%
FIGURE 2. Average daily smartphone pickups, by
participant age
26−50
0−25
16−17
13−15
11−12
28%
25%
16%
36%
15%
12%
51−100
29%
27%
28%
0%
>200
2%
8%
101−150
5%
16%
24%
151−200
8%
20%
0%
5 CONSTANT COMPANION: A WEEK IN THE LIFE OF A YOUNG PERSON'S SMARTPHONE USE © COMMON SENSE MEDIA. ALL RIGHTS RESERVED.
2. Phone use during school hours is
nearly universal but varies widely,
reflecting a patchwork of different
school policies.
Smartphone use at schools is fairly widespread, and it
varies based on school rules, teacher and staff enforce-
ment, and student compliance. During school hours
(Monday through Friday, 8 a.m. to 3 p.m., excluding holi-
days), 97% of participants used their phones, for a median
of 43 minutes (ranging from less than one minute to six and
a half hours). The median number of pickups was 13 per
school day, ranging from less than one to 229. The app cat-
egories that took up the highest proportion of time during
school hours were social media (32% of smartphone use
during school hours), gaming (17%), and YouTube (26%),
among participants who used those app categories (Figure 3).
Youth advisors told us that schools have a wide variety of poli-
cies, and variable enforcement within those policies, which
students may or may not follow:
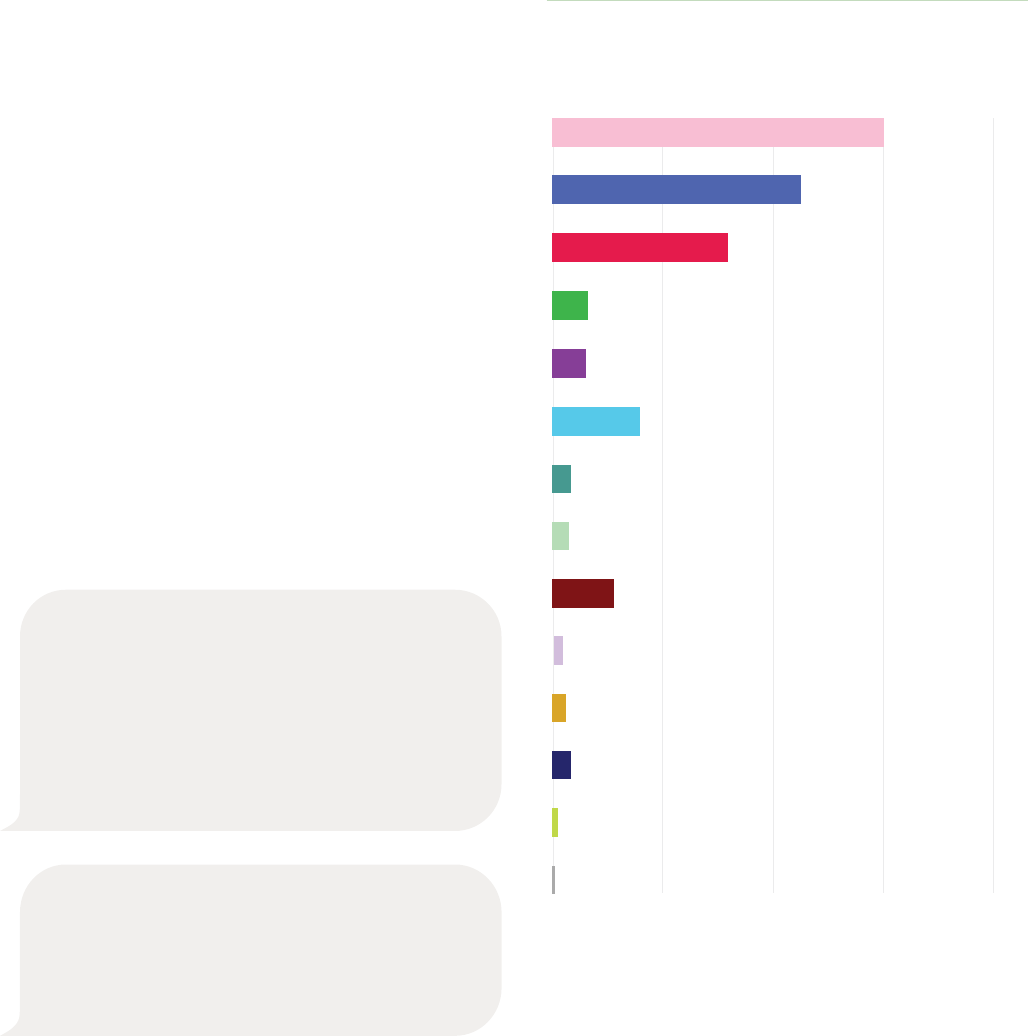
FIGURE 3. Median* duration of use of different smartphone
app categories during school hours**
*Median is the value that 50% of the users are under and 50% are over.
**Includes only participants who used that category of apps during specified
time frame.
Parent Controls (n=19)
Email (n=69)
Education (n=51)
Shopping (n=37)
Calls (n=132)
Reading (n=23)
Music and Audio (n=81)
Art and Photos (n=133)
Streaming Video (n=30)
Messaging (n=146)
Browser (n=150)
Gaming (n=119)
YouTube (n=111)
Social Media (n=126)
Average School Day Minutes (Median)
20100
For my school, we do have a phone policy and
we're not technically allowed to have it out during
class, but a lot of people do in spite of that. And
definitely, I think if you track kids at my school,
their phone usage, you would definitely see them
checking their phones, and then checking
Snapchat during class.
—10th grader
It's kind of up to teacher discretion. So at the
beginning of the year, they said it's not allowed,
but it's really up to each teacher whether they
allow it in the room or not. A lot of them do.
—11th grader
CONSTANT COMPANION: A WEEK IN THE LIFE OF A YOUNG PERSON'S SMARTPHONE USE 6© COMMON SENSE MEDIA. ALL RIGHTS RESERVED.
3. Notifications are plentiful, with
half of our participants receiving 237
or more per day. These interruptions
are both delightful and distracting,
leading many young users to feel the
need to manage what they get notified
of, and when.
While phone pickups signify how often a user is engaging with
their phone, notifications show us how often a phone tries to
engage its user. On a typical day, participants received a
median of 237 notifications. Of the notifications delivered to
their phone, participants saw or engaged with about a quarter
(median 46 per day). Notification frequency varied widely,
with maximums of over 4,500 delivered and over 1,200 seen
(Figures 4 and 5).
About a quarter (23%) of notifications arrived during school
hours, and about 5% during school night hours, suggesting
that phones and apps could do a better job of eliminating
unnecessary notifications at times of day that are more dis-
ruptive to young people. Very few participants received no
notifications at all during school hours or school night hours.
Because notifications are so numerous and occur day and
night, they require management by young users. Our youth
advisors described different approaches to managing these
interruptions. They said it was essential to filter or block noti-
fications, particularly from "spam" content, favoring
notifications of direct messages (DMs) from people.
Snapchat and Discord ranked highest in the number of notifi-
cations sent to participants in a typical day, with some
participants receiving hundreds of messages from these plat-
forms. But our youth council members noted that they've
become savvy to the ways in which some apps try to pull them
in with frivolous notifications.
Yeah, for me, I have notifications on for the apps
that are messaging apps, but then for the other
ones, I don't have notifications on for YouTube or
Instagram … For me, I don't like the notifications
that just tell you to go back on the app or just
something random like that, like an update or
something. I don't really care about those ones.
But the ones I do like getting are the ones that are
from the messaging apps, like if someone sends
me a text, I wanna know what it says.
—10th grader
FIGURE 4. Average daily notifications received by
smartphones
FIGURE 5. Average daily notifications seen by the user
>500
401-500
301-400
201-300
101-200
0-100
20%
20%
23%
9%
9%
20%
>200
151-200
101-150
51-100
26-50
0-25
28%
24%
21%
12%
7%
8%

7 CONSTANT COMPANION: A WEEK IN THE LIFE OF A YOUNG PERSON'S SMARTPHONE USE © COMMON SENSE MEDIA. ALL RIGHTS RESERVED.
I also think the TikTok algorithm is just way better
than any of the others. Even Instagram reels and
then YouTube Shorts is like the same thing as
TikTok, but the algorithm for TikTok is just way
more addicting, I feel like [it]… draws you in more,
and it also adapts really quickly. So if I skip a few
of the same type of video, it'll stop playing that
pretty quickly … I think it just happens naturally.
You just scroll without really looking at a certain
type of video a few times and then you'll see it
adapts and gives you some other type.
—11th grader
4. TikTok is irresistible, offering
bite-size pleasure and low-friction
interaction that quickly adapts to
the user's interests or mood.
TikTok was one of the most popular and longest-duration apps
used in the sample of 11- to 17-year-olds whose phones we
tracked. TikTok was used by 50% of our participants, for a
median of one hour and 52 minutes per day. Compared to
other social media apps, TikTok users were more likely to
spend several hours per day using it (upwards of seven hours
a day), often during school hours and overnight. In contrast,
the longest amount of time spent on Snapchat and Instagram
was around three hours per day.
Youth advisors explained to us that TikTok provides an experi-
ence that other social or video-sharing platforms don't. TikTok
was described as "easy" because videos simply start to play—
the user doesn't have to make any decisions, so there's no
friction. Adolescents we talked to said that the TikTok algo-
rithm "knows" them so well, they can expect that they will
likely find something fun to watch. If the user isn't interested
in the video that starts to play, the app quickly adapts to some-
thing more engaging or that fits their mood or desires. Finally,
the videos are short, so they provide small doses of pleasure
when young people need a break but don't have a lot of time.
Then TikTok, I honestly feel just because it's so
easy to feel, 'Oh, I only have 10 minutes. Let me
get onto TikTok right now 'cause I don't really
have time for anything else.' Because it provides
kind of instant entertainment, you don't really
have to go in, like on YouTube you have to go in,
you have to search for something, you have to
find a video that you wanna watch. And on
TikTok it's really just there. You can open it kind
of whenever you want. And even on a short
amount of time, you can still watch at least two
or three videos.
—11th grader
CONSTANT COMPANION: A WEEK IN THE LIFE OF A YOUNG PERSON'S SMARTPHONE USE 8© COMMON SENSE MEDIA. ALL RIGHTS RESERVED.
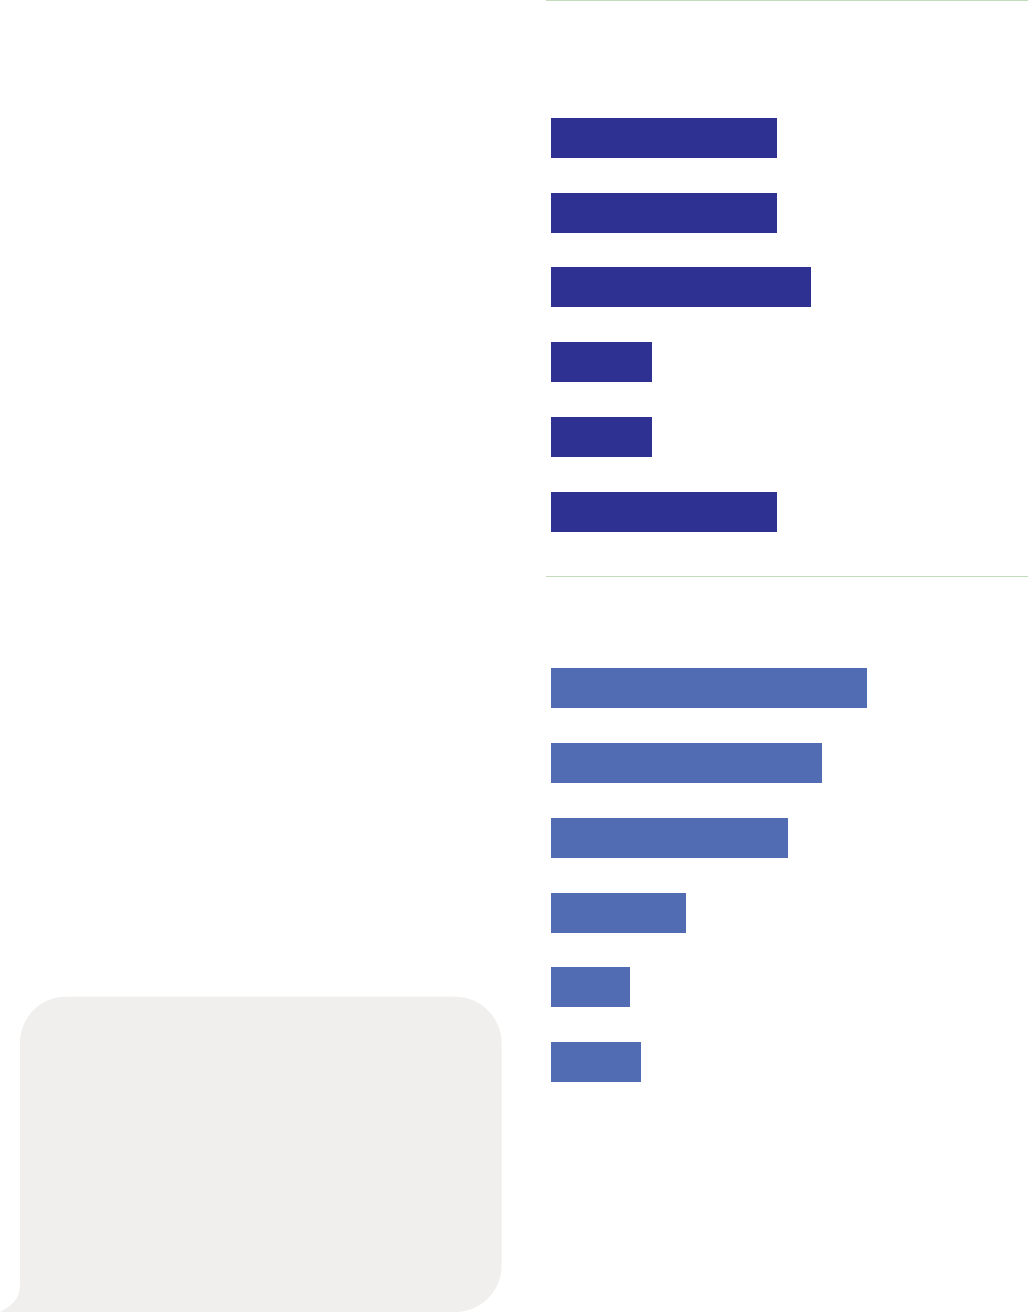
FIGURE 6. Median* duration of use of different smartphone
app categories during school nights**
*Median is the value that 50% of the users are under and 50% are over.
**Includes only participants who used that category of apps during specified
time frame.
Parent Controls (n=3)
Email (n=11)
Education (n=5)
Shopping (n=11)
Calls (n=9)
Reading (n=6)
Music and Audio (n=18)
Art and Photos (n=24)
Streaming Video (n=14)
Messaging (n=27)
Browser (n=49)
Gaming (n=32)
YouTube (n=54)
Social Media (n=60)
Average School Night Minutes (Median)
20100
5. Over half of teens used their phones
overnight on school nights, primarily
for social media, gaming, or YouTube.
We defined school night usage as any use Monday through
Friday during the hours of midnight to 5 a.m. (excluding holi-
days). Over half of participants (59%) used their phones on
school nights, with a median of about 20 minutes per night,
although use ranged from less than a minute to five hours.
Similarly, 67% of participants had pickups on school nights,
with a median of one per night, though at least one participant
picked up their phone 18 times on a typical school night.
App categories that took up the highest proportion of school
night use included YouTube (47% of smartphone usage on
school nights), social media (39%), gaming (29%), and reading
(18%), among participants who used those app categories.
YouTube appeared to be the longest-running app due to
several participants running it overnight, likely with music or
white noise playing. TikTok was also commonly used in the
overnight hours on school nights, but youth advisors reported
that TikTok can be overstimulating and lead to difficulties in
falling asleep.
I might say that for certain apps, like TikTok,
it's really hard to fall asleep once you use it close
to when you're gonna go to sleep. I can't use it
within an hour, or else I'd struggle … and then
I'll just get back on the app 'cause I'm not
sleeping anyway.
—10th grader

9 CONSTANT COMPANION: A WEEK IN THE LIFE OF A YOUNG PERSON'S SMARTPHONE USE © COMMON SENSE MEDIA. ALL RIGHTS RESERVED.
For me, even throughout the day, I keep 'do not
disturb' on, not even because I wanna not
respond to people or anything like that. I like
being able to not have my phone buzzing, but
being able to click on ... I don't know if I can show
you guys, but like here, you see this. Like you
have to click on that to see all of the notifications
that people have sent or everything that ... All the
notifications that you would have gotten if you
weren't on 'do not disturb.' For me, I like the extra
step because then it's like me having to do more
work to be on my phone, and I don't know, I feel
like it's a little strategy for me.
—11th grader
6. Smartphones can allow access
to age-inappropriate experiences,
including social media for kids under
13 and apps with mature/adult-only
ratings.
Of 85 participants who were under age 13, 68% used social
media apps, and they all used at least one app rated "Teen" or
higher. The most popular social platforms among 11- to
12-year-olds were TikTok (used by 47%), Snapchat (31%),
Discord (25%), Instagram (16%), Facebook (16%), and
Pinterest (14%).
In addition, almost half (45%) of our participants used apps
with mature (17+) or adult only (18+) ratings, such as Pornhub,
fantasy sports/betting apps (Yahoo Fantasy Sports & Daily,
Sleeper Fantasy Football), Telegram, Reddit, Parler, 4chan,
casino games, or violent games such as Call of Duty.
A small number (14) of participants used social media apps
with risky features, like being able to connect with strangers
for messaging, sending photos, or video chat. Although these
riskier social media apps did not take up as much time as more
mainstream social media apps, even brief use might lead to
problematic interactions with adults.
7. Young users admit they have
challenges managing their technology
use, but through steps like curation and
adding friction, they're working on it.
In addition to tracking their phones, we surveyed our 203
participants to ask whether they had any problems managing
their technology use. Over two-thirds of these 11- to 17-year-
olds said they "sometimes" or "often" find it difficult to stop
using technology, use technology to escape from sorrow or get
relief from negative feelings, and miss sleep due to being on
their phone or the internet late at night. These impacts may be
due to the natural pull that adolescents feel toward their social
contacts through their phone, but the engagement-prolonging
design of apps and platforms also likely contributes.
Interestingly, our youth advisors described ways of adding
friction to their phones to try to use them more intentionally:
CONSTANT COMPANION: A WEEK IN THE LIFE OF A YOUNG PERSON'S SMARTPHONE USE 10© COMMON SENSE MEDIA. ALL RIGHTS RESERVED.
11 CONSTANT COMPANION: A WEEK IN THE LIFE OF A YOUNG PERSON'S SMARTPHONE USE © COMMON SENSE MEDIA. ALL RIGHTS RESERVED.
Study design
A diverse sample of 203 U.S. preadolescents (ages 11 to 12)
and adolescents (ages 13 to 17) with their own smartphones
were recruited by Horowitz Research between August and
November 2022 (see Table 1). Parents and caregivers of
tweens and teens were contacted with brief information
about the study, and if interested, provided informed consent
for the child and shared the child's email address. Children
were then contacted by email and provided online informed
consent before completing a baseline questionnaire and
installing the Chronicle app (Methodic, Inc) onto their smart-
phone. Eligibility criteria included: 1) ages 11 through 17; 2)
speaks English or Spanish fluently enough to complete
informed consent and surveys; 3) has their own Android
(version 6.0 or above) smartphone (e.g., Samsung, Google
Pixel, Motorola, etc). iPhone users were not included because
data collection access for detailed app usage (i.e., names of
specific apps such as YouTube, Snapchat, etc.) was not avail-
able for researchers at the time of data collection. The study
was approved by the University of Michigan IRB.
Baseline surveys
Parents reported their educational attainment, household
income, and their child's race/ethnicity. Child participants
completed a brief online survey that included the Technology
Impairment Scale (six items, alpha = 0.76, Burnell & Odgers,
2023, adapted from Meerkerk et al., 2009) which assesses
compulsive technology use or interference with daily activi-
ties (e.g., Do you feel restless, frustrated, or irritated when you
cannot access the internet or check your mobile phone? Do you use
technology to escape from your sorrow or get relief from negative
feelings?) on a response scale of 0 = never, 1 = sometimes, 2 =
often.
Mobile device tracking
Participants were instructed on how to install and set up the
Chronicle app and keep it running on their device for nine
complete days. This app was developed with NIH funding,
pilot-tested and validated against pen-and-paper logs of
smartphone use, and has been used in child and parent popu-
lations (Radesky et al., 2020). After nine days, participants
were contacted and prompted to uninstall Chronicle and data
were exported from the Methodic Chronicle dashboard.
Chronicle provides timestamped data about which app is
running in the foreground and when pickups and notifications
occur, but does not collect information about contacts,
message content, which websites are visited, or what content
is viewed on platforms. In the informed consent form, partici-
pants were provided clear explanations of what data would be
collected, how it would be used, and how soon it would be
deleted.
Data cleaning and inspection processes were used to identify
any missing gaps in smartphone data (e.g., no data for >12
hours) and reduce the duration of apps that sometimes run
long but are not true usage (e.g., launcher, screen saver, alarm
clock). Some participants' data crossed two time zones, indi-
cating that they traveled during data collection, so we
removed the time zones that occurred on fewer days before
analyzing time-stamped data. We visually inspected all over-
night data to ensure that it showed data characteristics of true
usage (i.e., rather than data irregularities that occasionally
occur). Chronicle data was then processed to calculate hourly
and daily duration, pickups, and notifications, as well as dura-
tion and notifications for popular apps and app categories.
Notification and pickup data were not available for four par-
ticipants with older versions of the Android operating system.
Data for each participant were also visualized using R.
App categorization
We pulled data from the Google Play store API corresponding
to each app package name, including the app category (e.g.,
gaming, photography, shopping, social) and content rating
(e.g., Everyone, Teen, 17+, 18+/Adult). Apps that could not be
found on the Play store were manually categorized. We col-
lapsed or expanded some categories to reflect the main types
of apps used by 11- to 17-year-olds. For example, "communica-
tion" apps were recategorized into more precise categories
that reflect different uses, such as calls, email, or chat/messag-
ing. We categorized any app as Social Media if it involved a
non-SMS platform that facilitated the exchange of text, video,
and photo content with interaction by users (e.g., Snapchat).
However, we separated YouTube into its own category (includ-
ing YouTube, YouTube Kids, and YouTube TV) because of the
unique usage patterns YouTube has shown in our prior work
(e.g., Radesky et al., 2020).
Methodology
CONSTANT COMPANION: A WEEK IN THE LIFE OF A YOUNG PERSON'S SMARTPHONE USE 12© COMMON SENSE MEDIA. ALL RIGHTS RESERVED.
TABLE 1. Participant characteristics
Characteristic N %
Age category
11 to 12 85 41.9%
13 to 15 93 45.8%
16 to 17 25 12.3%
Gender
Female 89 43.8%
Male 112 55.2%
Nonbinary 1 0.5%
Other/prefer not to answer 1 0.5%
Race/Ethnicity
Asian/Native Hawaiian/Pacific
Islander
20 9.9%
Black or African American 39 19.2%
Hispanic/Latino/a/x/e 44 21.7%
Some other race 9 4.4%
White 91 44.8%
Household annual income category
<$50,000 71 35.5%
$50,000 to $99,999 77 38.5%
$100,000 or more 52 26.0%
Respondent parent education
High school/technical school or less 31 15.4%
Some college 55 27.2%
College degree 73 36.1%
More than a college degree 43 21.3%
Children in household (including participant)
1 67 33.0%
2 67 33.0%
3 41 20.2%
4 or more 28 13.8%
Respondent parent marital status
Married or living with a partner 146 71.9%
Separated or divorced 21 10.3%
Single 33 16.3%
Widowed 3 1.5%
Data analysis
We conducted descriptive analyses of the average daily dura-
tion of use, number of pickups (defined as the number of times
the screen turned on due to a user action), and number of
notifications. Notification data from the Chronicle app
included both notifications delivered to the smartphone
(regardless of whether the notification was audible or
silenced, as Chronicle does not collect that information) as
well as notifications seen by the user (indicating that the noti-
fication was interacted with by the user or appeared when the
user had the phone screen on). Notifications are delivered by
a wide range of apps, from utilities to texting apps, so duration
and notification data were also analyzed for particular app
categories and individual apps popular within the sample (e.g.,
TikTok). If a participant did not use their phone on a given day,
that day was excluded from analyses, so that the estimates
reflected what tweens and teens did during typical days of
use. We also segmented estimates of duration and pickups
into school hours (Monday through Friday, 8 a.m. to 14:59
p.m., excluding summer/holidays), or school overnight
(Monday through Friday, 12 a.m. to 4:59 a.m., excluding
summer/holidays) period. We calculated the number/percent-
age of participants who used app categories, specific common
social media apps and video games, and whether participants
endorsed positive or negative online experiences or different
technology impairment symptoms.
We used Chi Square and Kruskal Wallis bivariate tests to
study associations between smartphone usage variables and
age range (11 to 12, 13 to 15, and 16 to 17).
Post-analysis youth focus groups
Fifteen members of the 2023 Common Sense Youth Advisory
Council participated in four separate online focus groups with
the goal of helping the research team interpret and contextu-
alize findings from smartphone data. Parents or guardians of
Youth Advisory Council members had provided consent for
their children to participate, and members provided verbal
consent for audiotaping of Zoom focus groups, which were
then transcribed. First and last authors then reviewed themes
that arose from these groups and selected quotes for the
current report that aided with interpretation of findings from
a youth point of view.
CONSTANT COMPANION: A WEEK IN THE LIFE OF A YOUNG PERSON'S SMARTPHONE USE 14© COMMON SENSE MEDIA. ALL RIGHTS RESERVED.
Main Findings
How much time were
preadolescents and adolescents
spending with their smartphones?
Time spent with smartphones, or any digital media for that
matter, can mean a variety of things. One hour of smartphone
use might mean an hour laughing with friends, messaging
about homework, consuming influencer content on social
platforms, responding to harassing comments, or getting lost
in a video game. Time spent with a smartphone might find an
adolescent user fully engaged, or might reflect apps running in
the background while the user multitasks. Therefore, these
results regarding smartphone time are the most basic
measure of a young person's relationship with their phone;
however, they hint at how pervasively a phone occupies a
teen's time on a typical day.
When averaged across all days their smartphones were
tracked, participants used their phones for a median of about
four and a half hours per day, but there was a wide range of
usage among different teens as shown by the duration catego-
ries in Figure 1. At the high end, almost 10% of participants
used their smartphones for 10 or more hours per day on
average.
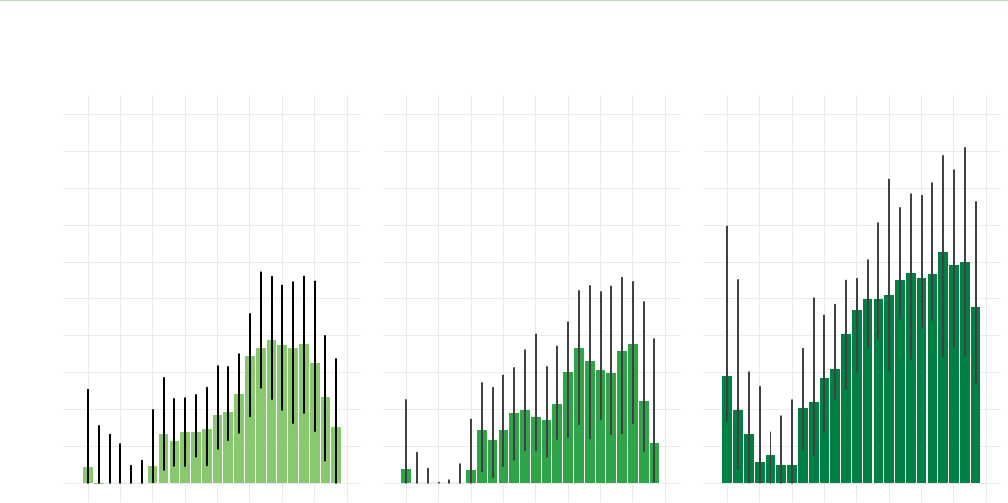
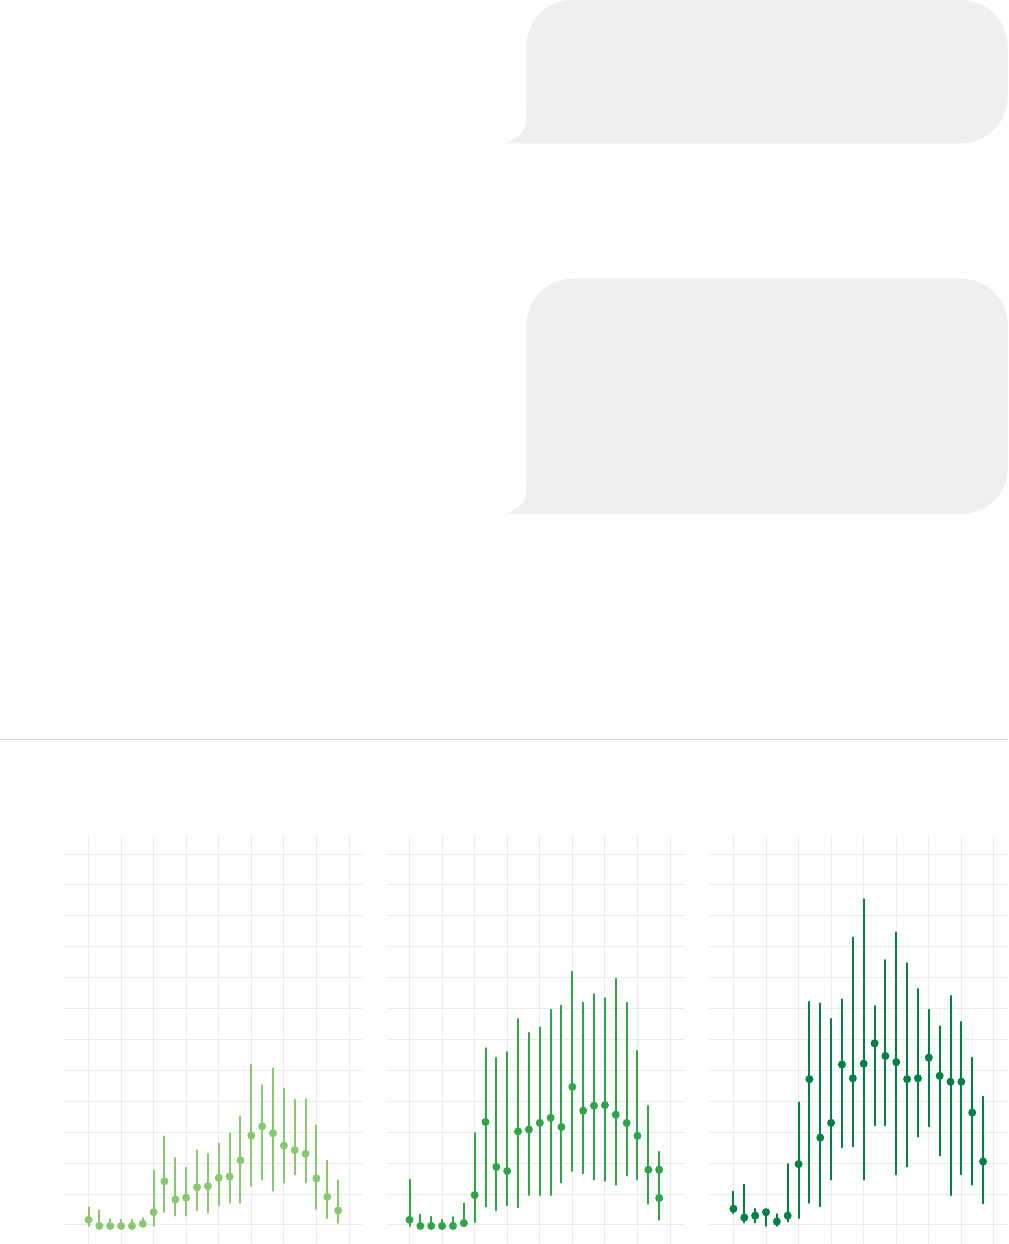
Hour-by-hour averages of smartphone use are shown in
Figure 7. Across all 203 participants, it is clear that the peak of
usage occurs in the afternoon and evening hours. Our youth
advisors stated that their smartphone is often by their side
after school, while doing homework, or when trying to wind
down before bed. Compared to younger participants, more
older teens (16- to 17-year-olds) used their phone in the over-
night hours.
12am 6am 12pm 6pm 12am
0
10
20
30
40
50
12am 6am 12pm 6pm 12am
Average Duration in Minutes (median [IQR])
Time of Day
12am 6am 12pm 6pm 12am
16-1713-1511−12
*Median is the value that 50% of the users are under and 50% are over. IQR is the Interquartile Range, which is the middle 50% of users, with 25% of users under the first value
and 25% of users over the second value. Bar shows the median value; line shows IQR.
FIGURE 7. Hour-by-hour plots (from midnight to midnight) of average smartphone use* in minutes, split by age group
15 CONSTANT COMPANION: A WEEK IN THE LIFE OF A YOUNG PERSON'S SMARTPHONE USE © COMMON SENSE MEDIA. ALL RIGHTS RESERVED.
However, they also expressed that managing their smart-
phone takes work, and being without their phone can be
freeing:
I feel like we'd all feel a lot better if we were on it
less. Like, when I lost my phone … I didn't have a
phone for a week, and that week was amazing.
Although I couldn't... I had to use my friends'
phones to contact people if I needed to text
them. Just not having a phone, it takes this weight
off of you. It almost sets you free in a way.
—11th grader
When I'm doing work, I like putting my phone to
the side, and whenever I give myself breaks, I'll go
to my phone and check notifications.
—11th grader
Participants picked up their phones a median of 51 times per
day, ranging from two to 498 times per day. When pickups
were graphed hour by hour (Figure 8), it was apparent that
teens (age 13 to 17) check their phone regularly through the
middle of the day (i.e., during school hours) as well as after
school. Younger participants (age 11 to 12) had the lowest
frequency of pickups per hour. Our youth advisors thought
this was probably due to younger smartphone owners having
more phone restrictions and rules placed by their caregivers
as well as smaller social networks to keep in touch with.
Time spent on smartphones varies widely.
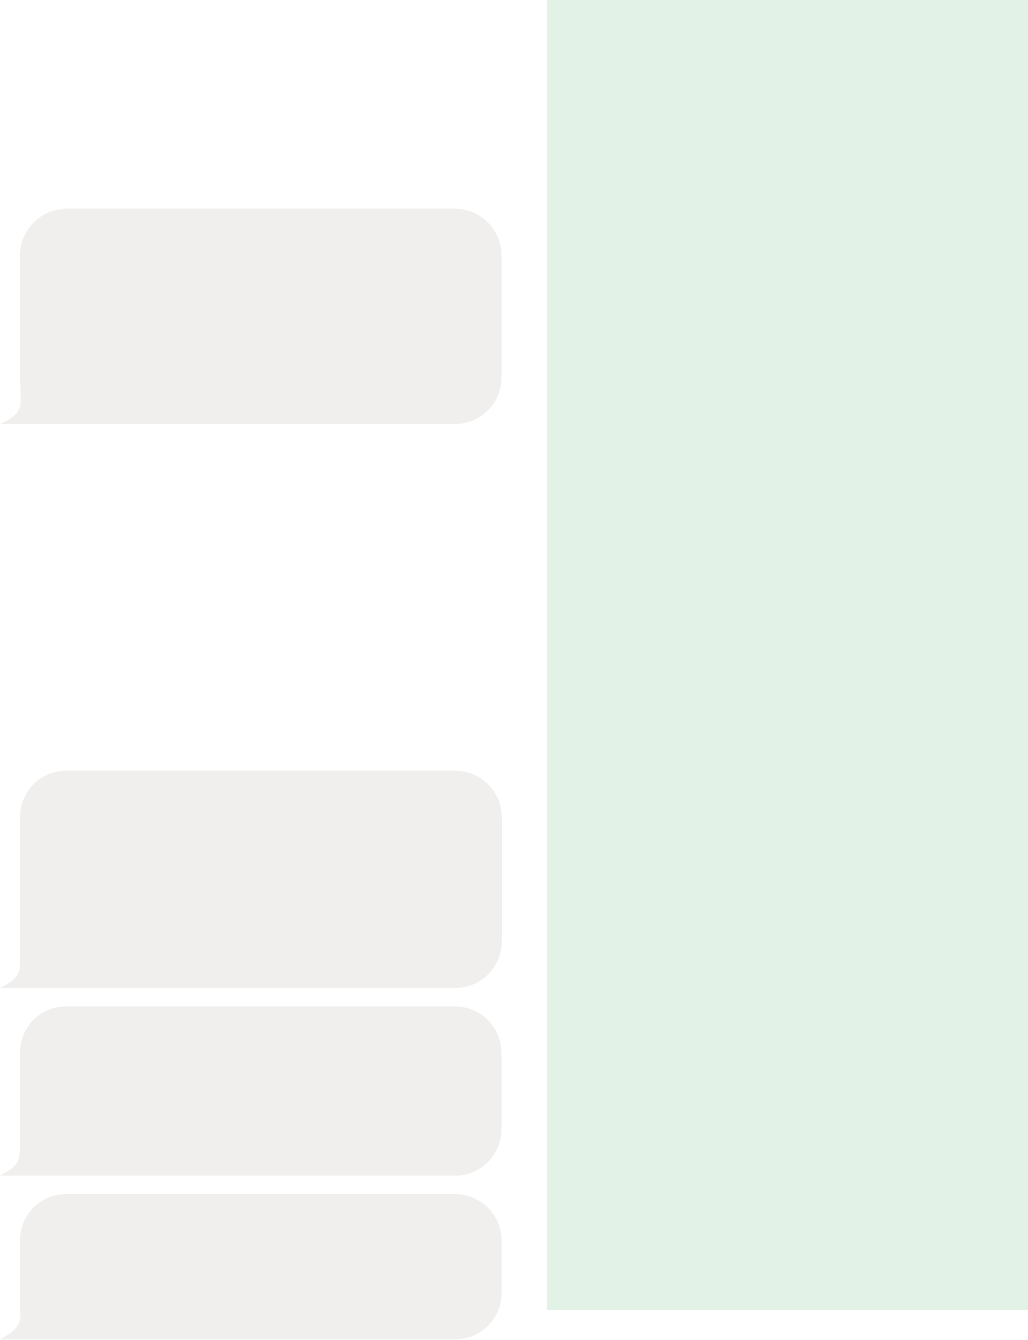
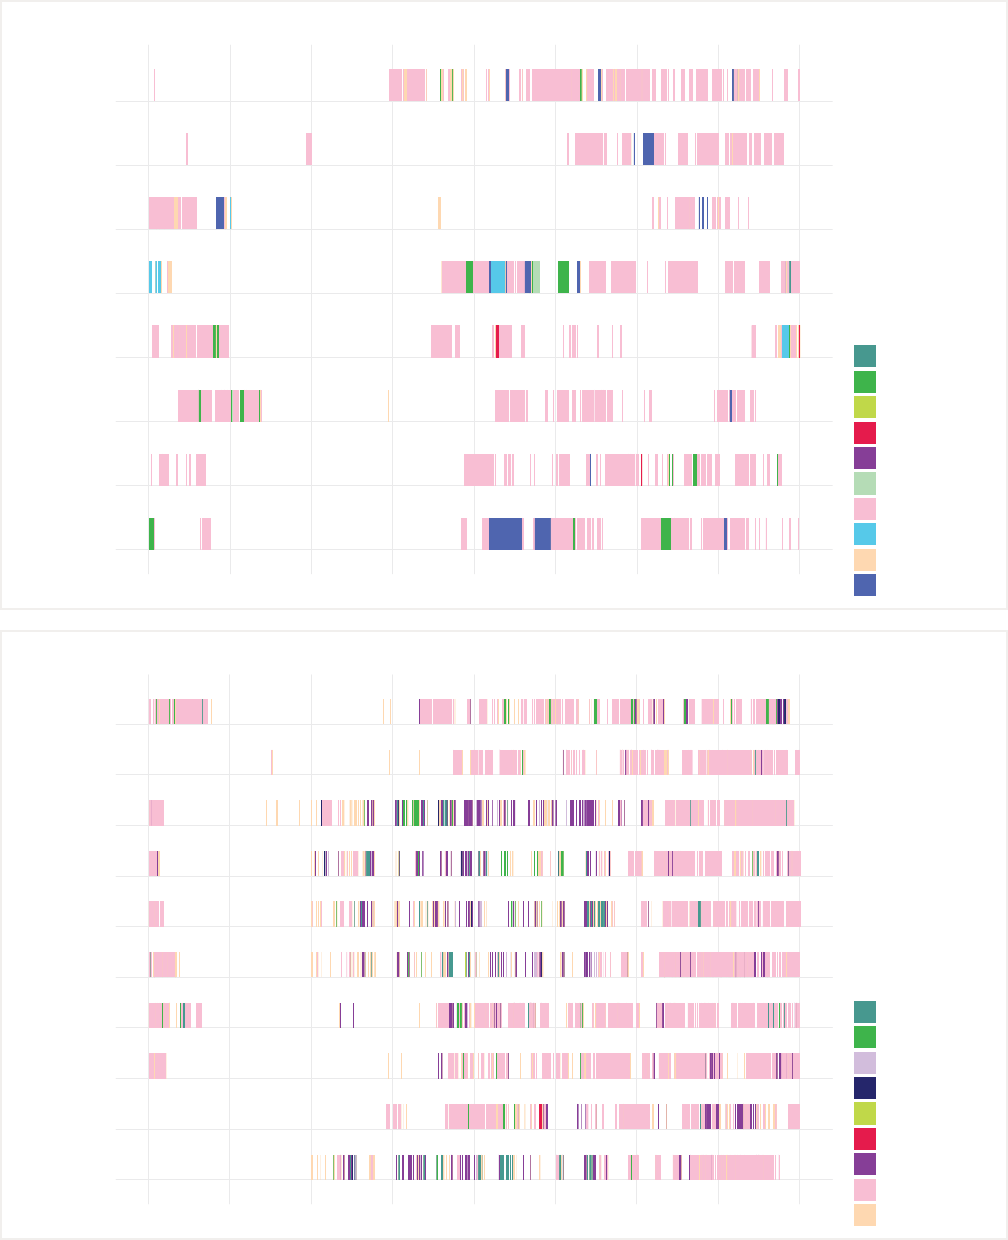
Youth advisors were also intrigued by the extreme ends of
smartphone usage found in our study sample. While most
agreed that five hours per day seemed like the amount of time
most of their peers spend on their phone, they were surprised
that some 11- to 17-year-olds would use phones for only a few
minutes per day, or up to 16 hours/day. The daily usage pat-
terns of five participants with the lowest-duration usage, and
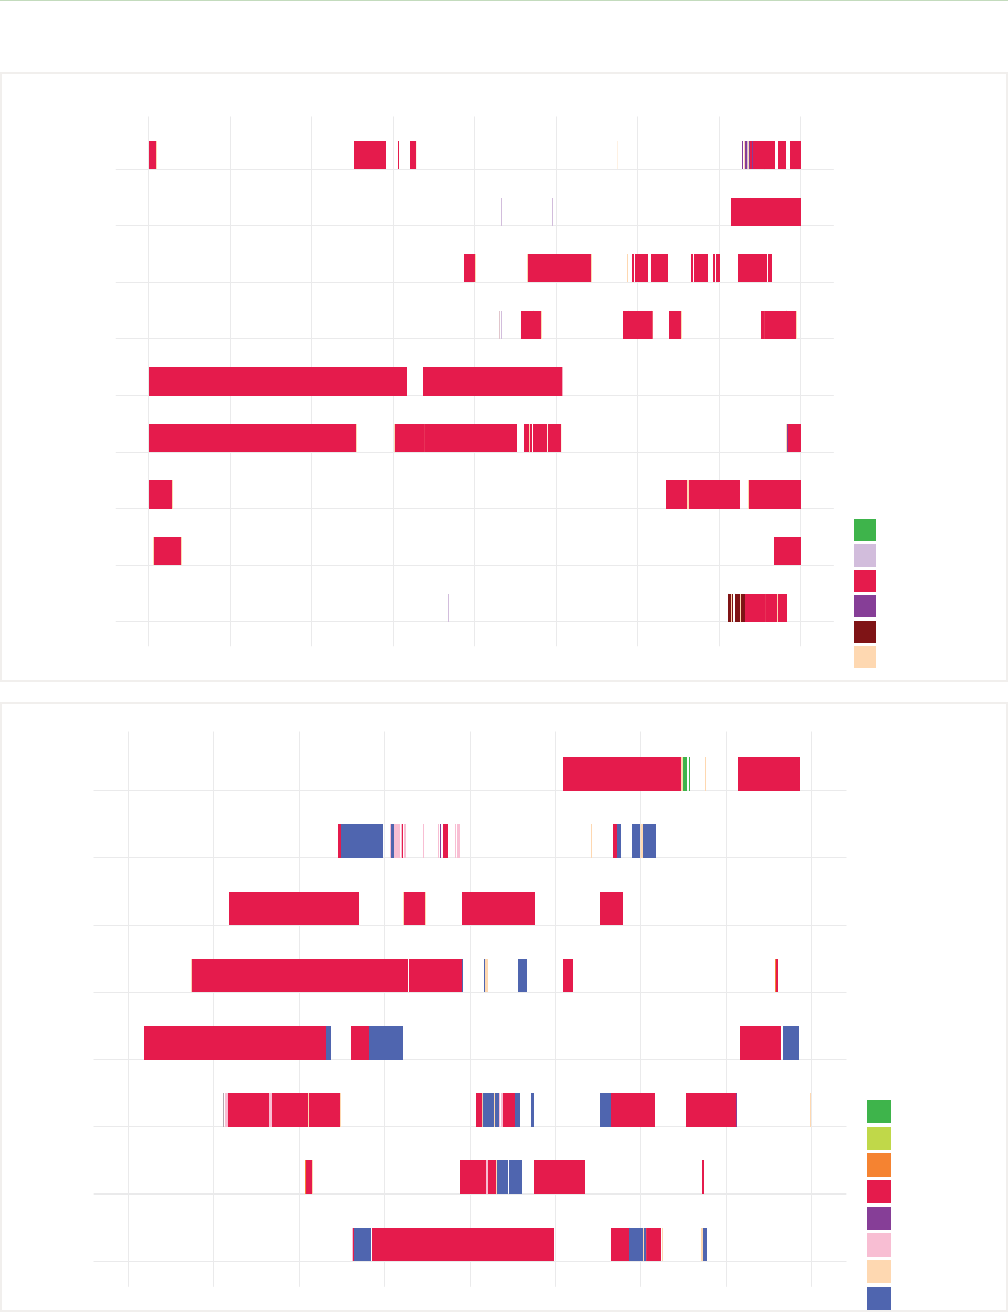
five with the most pervasive usage, are shown in Figures 9 and 10.
When talking about how much time their phone use takes up
in a day, most youth advisors felt that their phone integrates
into their daily experience in a non-burdensome way, and
provides small amounts of pleasure or social connection while
they do other things.
Average Pickups (median [IQR])
2
4
6
8
10
12
0
12am 6am 12pm 6pm 12am 12am 6am 12pm 6pm 12am 12am 6am 12pm 6pm 12am
Time of Day
16-1713-1511−12
*Median is the value that 50% of the users are under and 50% are over. IQR is the Interquartile Range, which is the middle 50% of users, with 25% of users under the first value
and 25% of users over the second value. Dot shows the median value; line shows IQR.
FIGURE 8. Hour-by-hour plots (from midnight to midnight) of average smartphone pickups*, split by age group
CONSTANT COMPANION: A WEEK IN THE LIFE OF A YOUNG PERSON'S SMARTPHONE USE 16© COMMON SENSE MEDIA. ALL RIGHTS RESERVED.
TAKEAWAYS
For most adolescents, smartphones take up a large
proportion of their waking hours. Whether this feels
like time well spent depends upon what they're expe-
riencing, what the smartphone is augmenting vs.
interrupting, and the other positive activities the
person had access to that day.
It's important to remember that smartphones are
going to be in both the background and the foreground
of kids' minds.
Young people's phone use patterns vary significantly
from each other, and the unique way that smartphones
interweave into a young person's day feels personal.
Many kids have a signature or pattern to their phone
use, their main "thing" that they love doing (or feel
obsessed with) on their phone, so it's worth helping
them reflect on how their particular personality influ-
ences their relationship with their phone.
TALKING POINTS
Adults can ask:
• What is your favorite app? Do you feel stressed
or excited by it? Or both?
• Does it feel like a job or "work" to stay up to date
on everything?
• What does it feel like when your phone is
commanding your attention vs. just being in
the background of your mind?
• What does it feel like when you don't have your
phone or the room is too quiet? Are you worried
about missing out on anything?
• Have you ever noticed what you're thinking
about if there's no background noise on?
• Do you ever get a sense that you've been on your
phone too long? What are the signs for you?
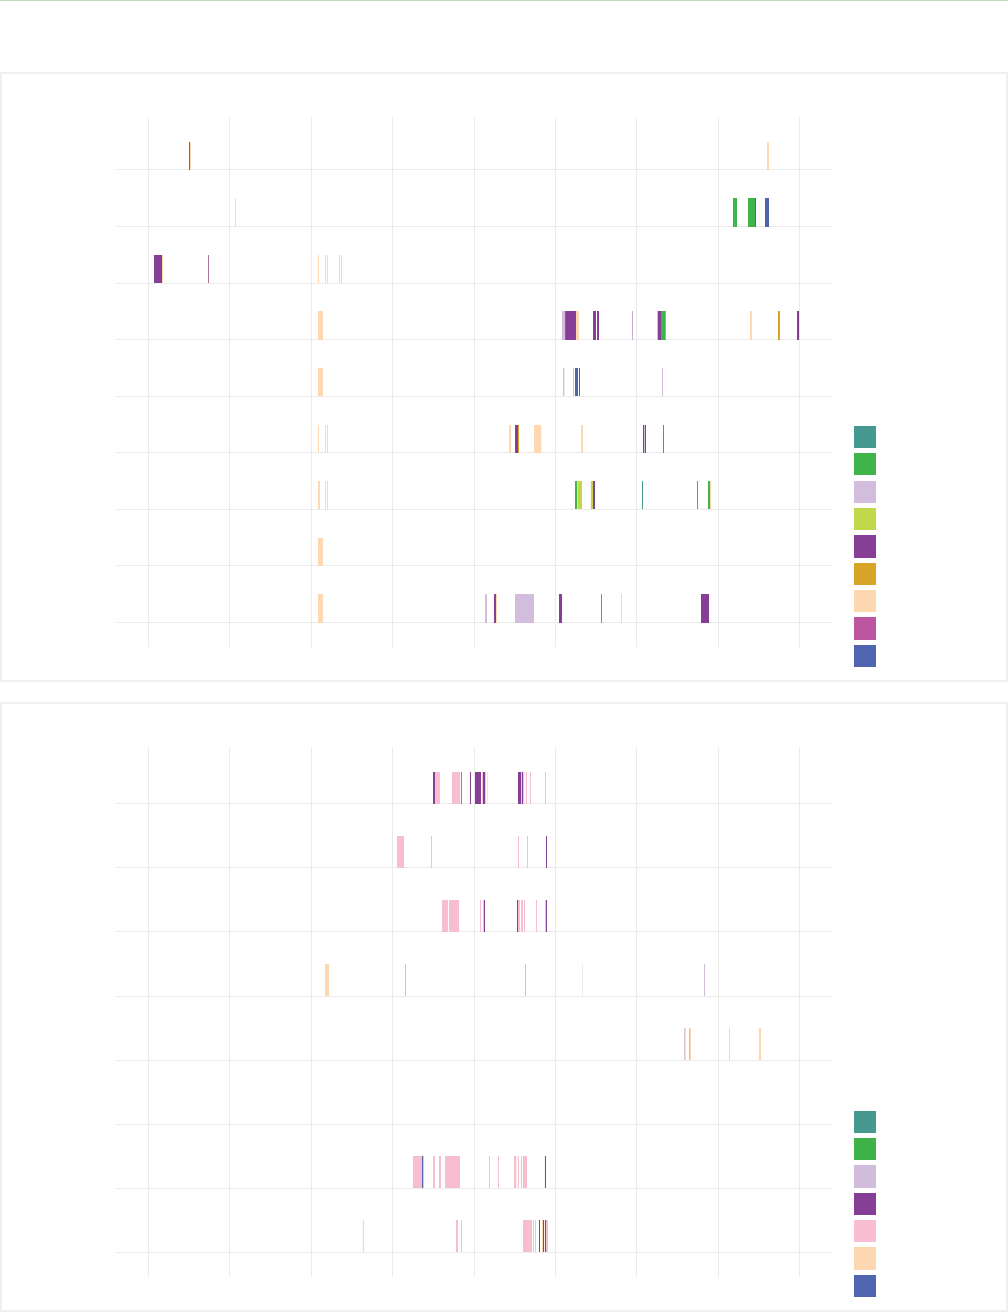
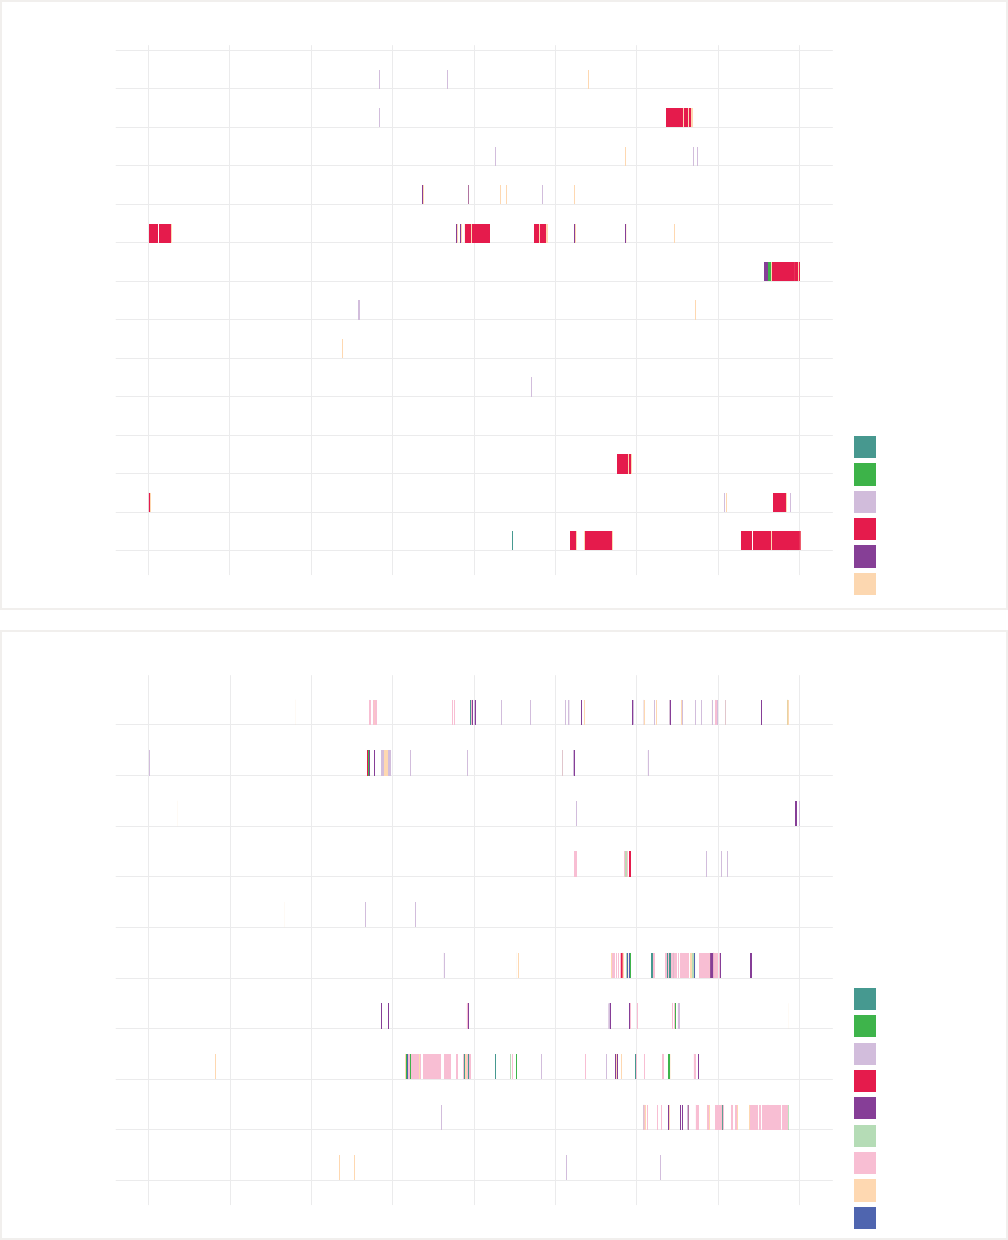
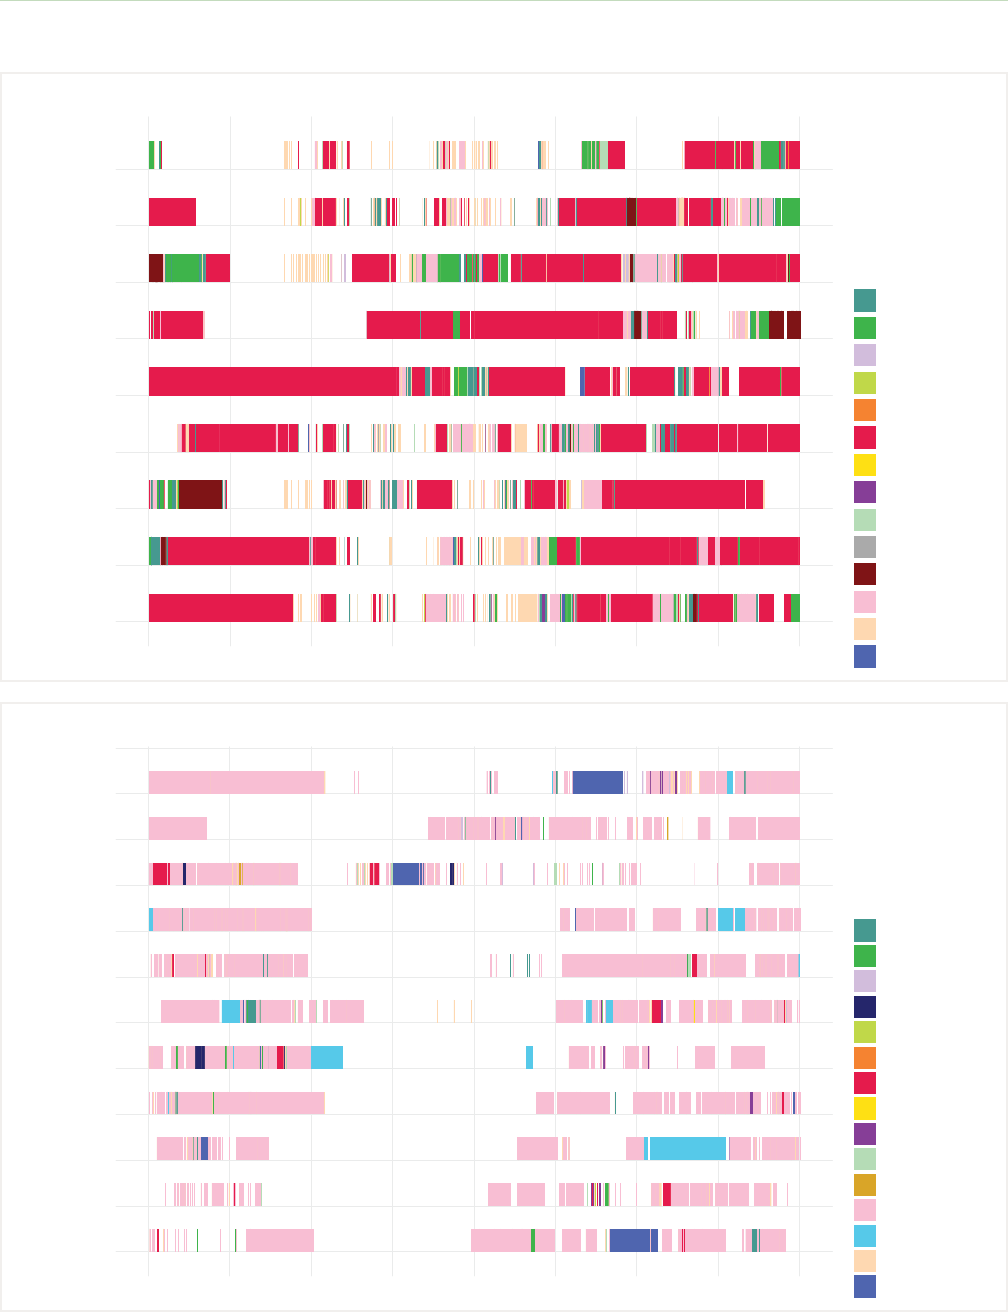
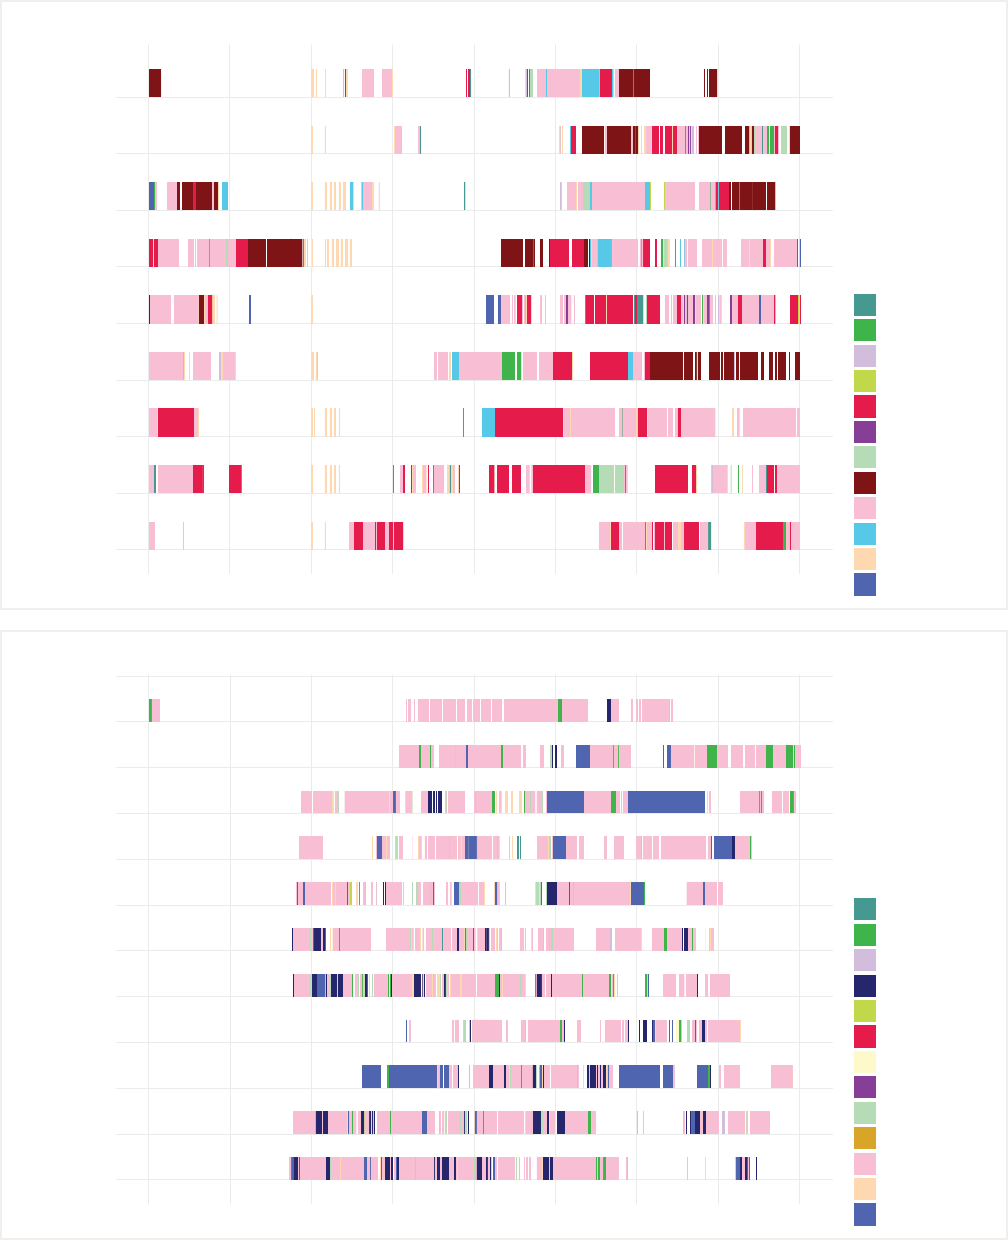
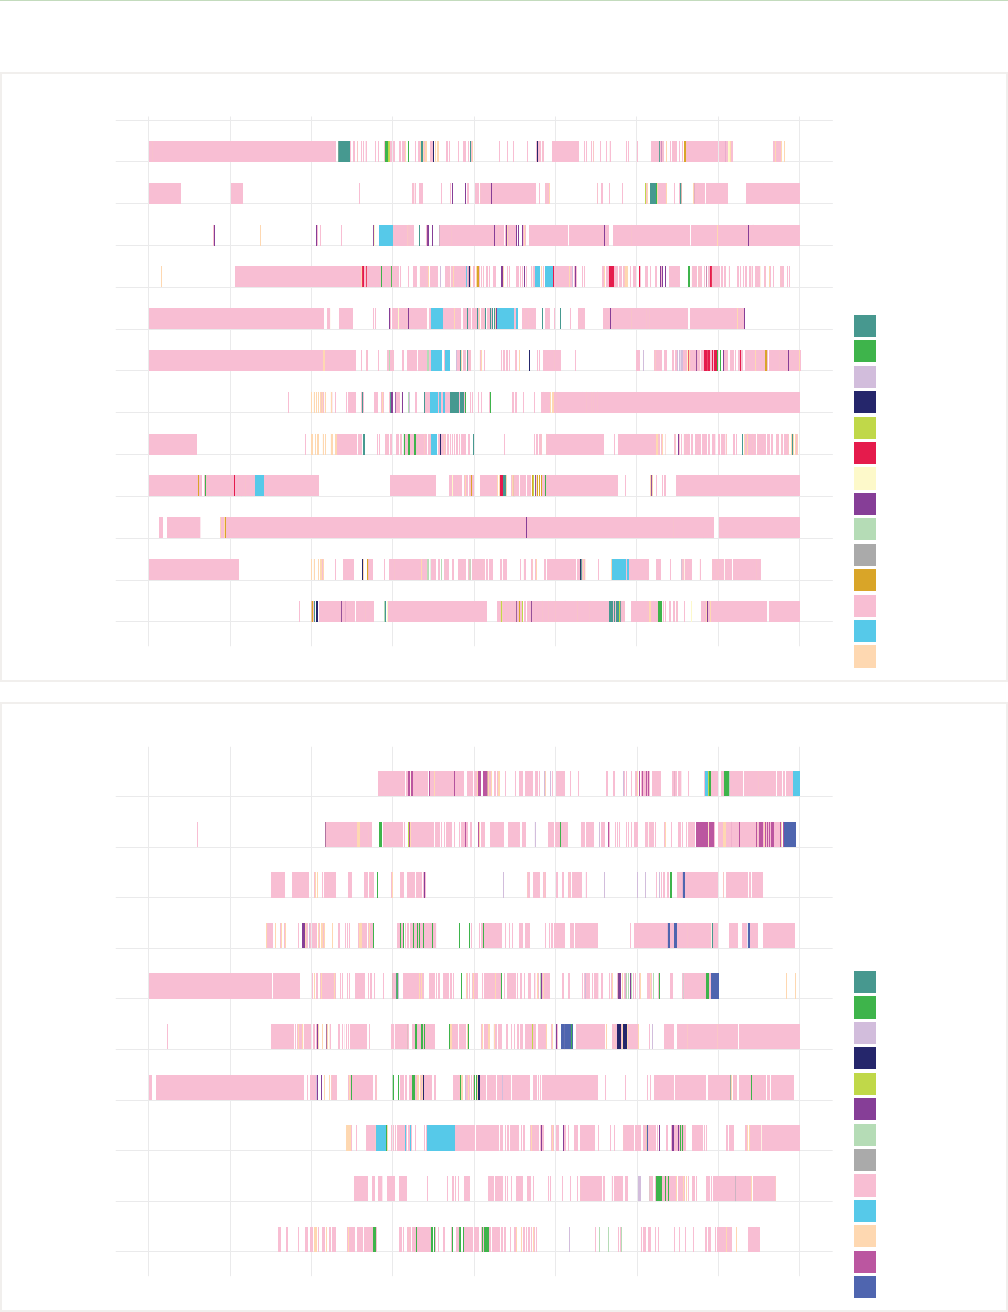
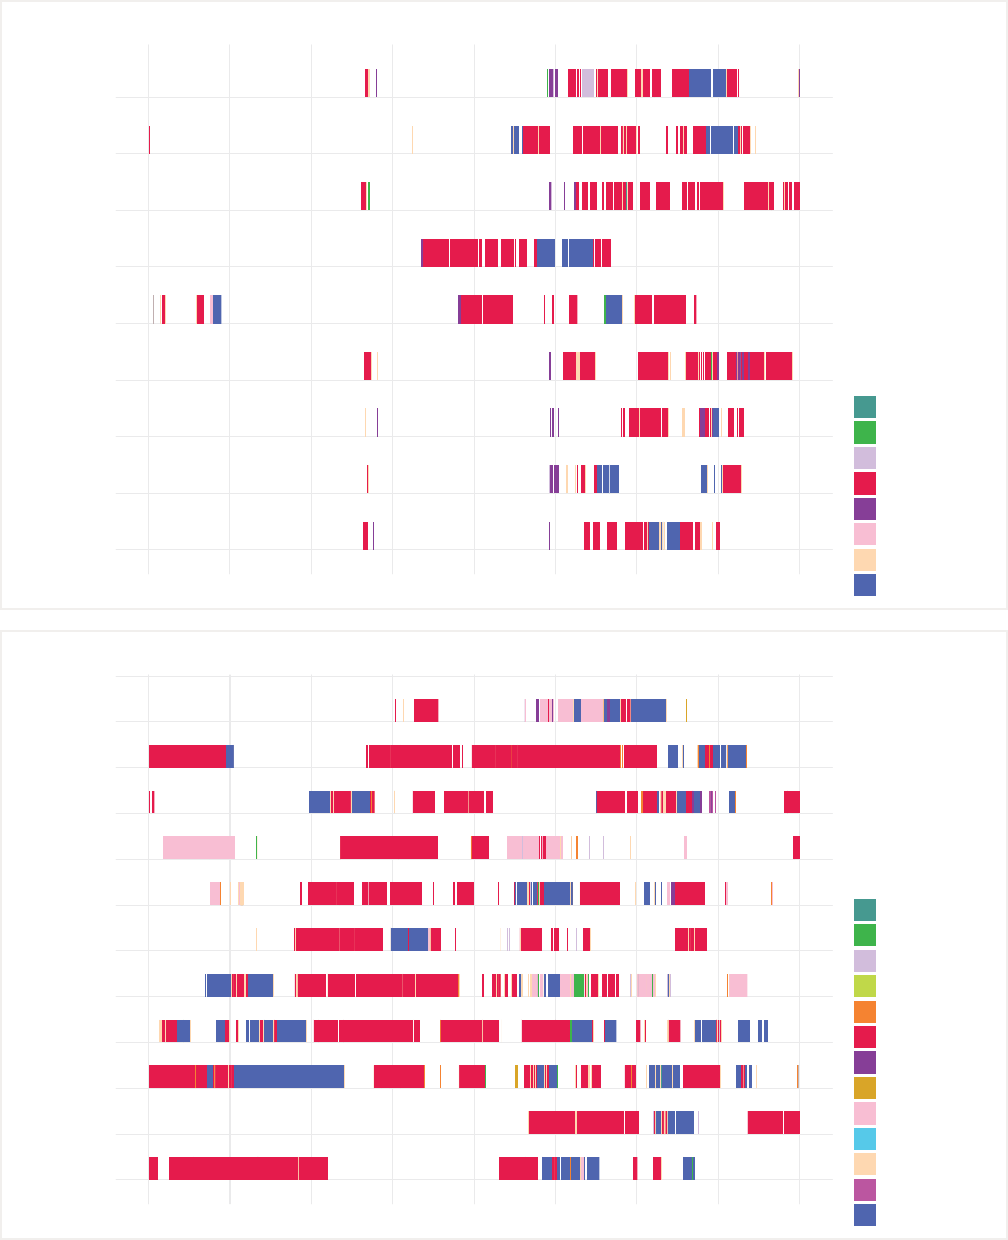
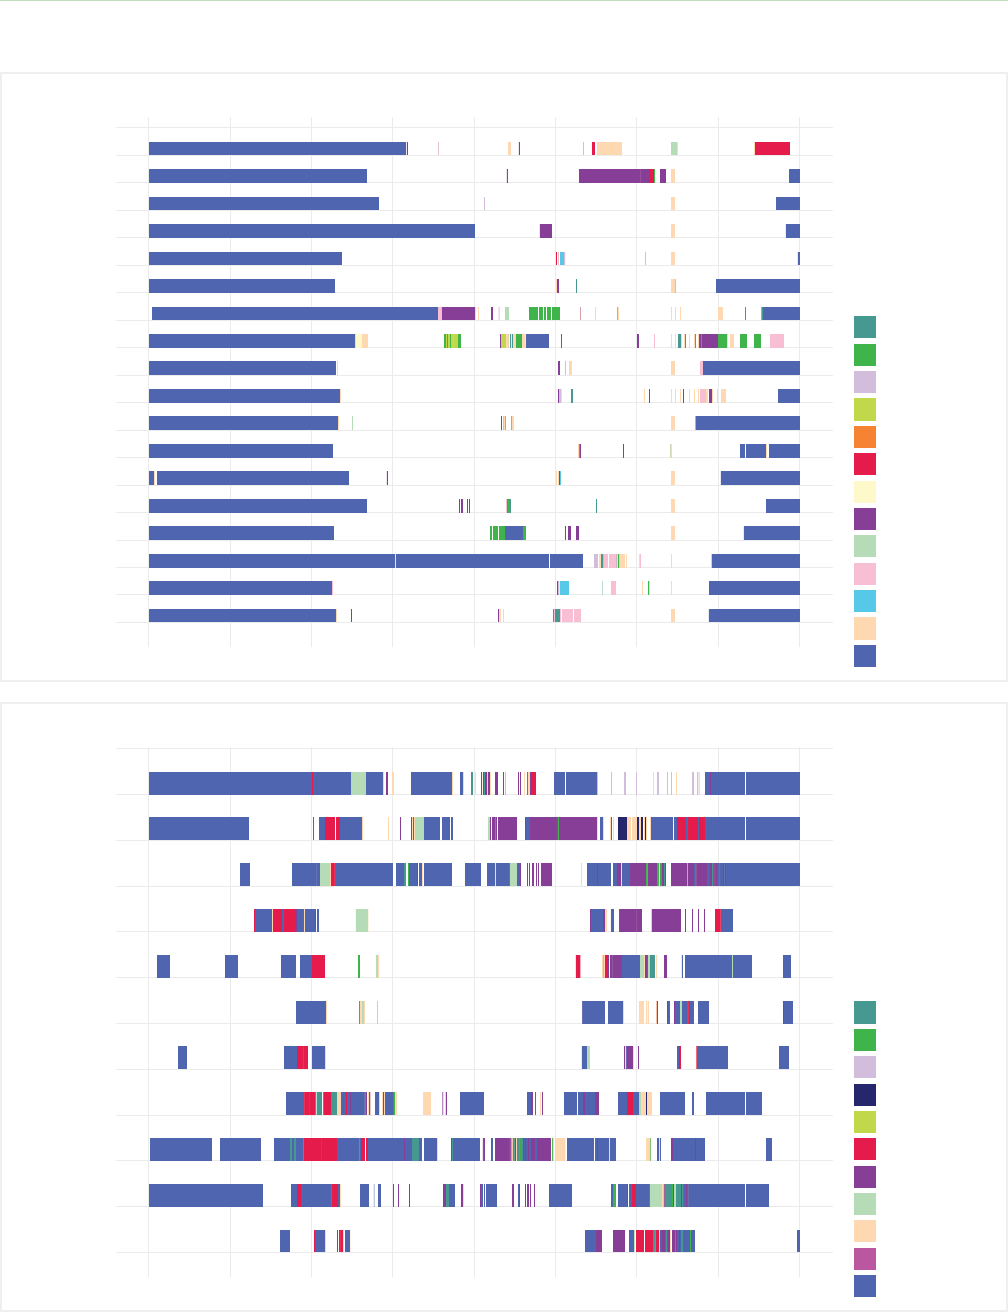
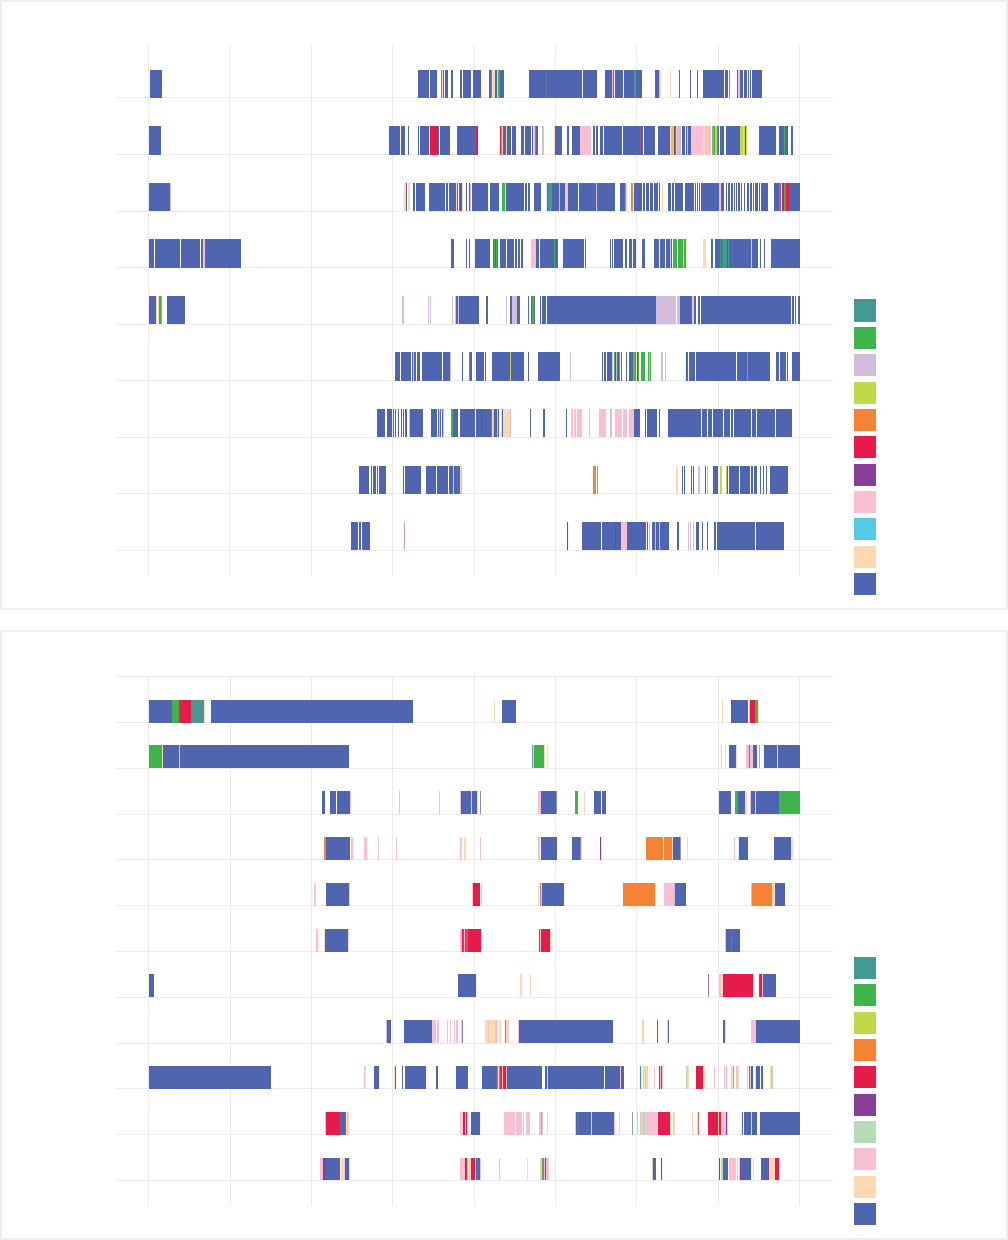
The adolescents we talked to also reflected on the fact that,
when looking at phone usage visualizations, it seemed that
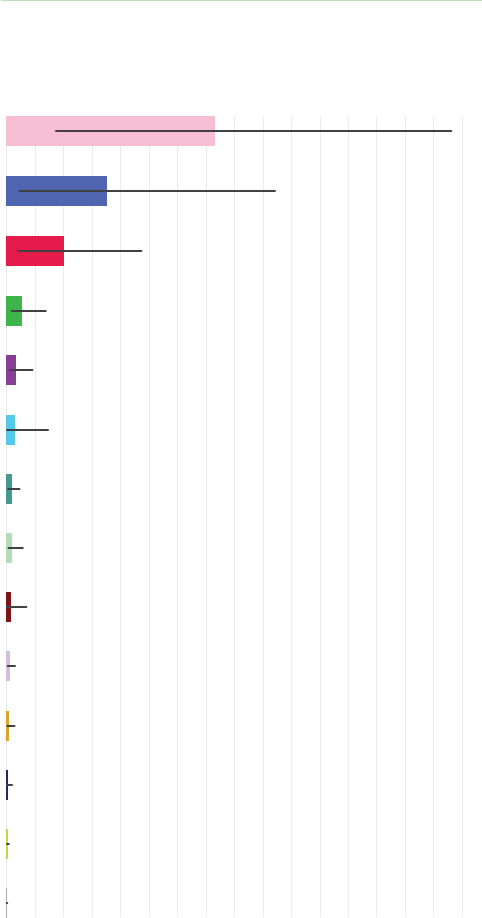
each participant had their own "style" of use—their "thing"
that they tended to do more than any other activity on their
phone, such as social media (shown as pink shading; Figure 11),
mobile games (red shading; Figure 12), or YouTube (royal blue
shading; Figure 13).
Not all smartphone use is active; some is
background noise.
Youth advisors emphasized that it's important not to assume
that all usage appearing on participants' day-to-day visualiza-
tions was active smartphone usage. They described use of
phones as "background noise"—for example, streaming
movies or videos or music—while doing other activities. This
ambient use of smartphones in the background was described
as having a "stimulation" or calming purpose, in contrast to
engaged usage, such as texting with a friend, that "you can't
just blur out" into the background.
It seems like everybody has their own thing that
they're obsessed with. Like this person has
reading, versus another person has some sort of
YouTube. And it's different for each person, but
everybody seems to be using one thing as a
means to stay connected or to spend time.
—12th grader
Like I see kids in school literally just have
TikTok on autoplay while they're doing work,
like it's sitting on their desk, but they're not even
looking at it. It's just like to have some sort of
stimulation in their brain, I guess, while they're
doing something.
—10th grader
I know a lot of people who work with
Netflix playing. They'll just have it playing
either on their phone or on their computer,
or they'll sleep to it.
—11th grader
I definitely do that. Like if I'm doing laundry, if I'm
doing homework, I'll just have something so that
my room isn't quiet. I kind of enjoy that buzz.
—12th grader
17 CONSTANT COMPANION: A WEEK IN THE LIFE OF A YOUNG PERSON'S SMARTPHONE USE © COMMON SENSE MEDIA. ALL RIGHTS RESERVED.
FIGURE 9. Participants with light smartphone usage
12am 6am 12pm 6pm 12am
App Categories
Art and Photos
Browser
Calls
Messaging
Social Media
Tools
YouTube
2022−10−06
2022−10−07
2022−10−08
2022−10−09
2022−10−10
2022−10−11
2022−10−12
2022−10−13
13-year-old male
2022−10−08
2022−10−09
2022−10−10
2022−10−11
2022−10−12
2022−10−13
2022−10−14
2022−10−15
2022−10−16
12am 6am 12pm 6pm 12am
App Categories
Art and Photos
Browser
Calls
Email
Messaging
Shopping
Tools
Video Chat
YouTube
13-year-old male
CONSTANT COMPANION: A WEEK IN THE LIFE OF A YOUNG PERSON'S SMARTPHONE USE 18© COMMON SENSE MEDIA. ALL RIGHTS RESERVED.
App Categories
Art and Photos
Browser
Calls
Gaming
Messaging
Music and Audio
Tools
Social Media
YouTube
2022−10−06
2022−10−07
2022−10−08
2022−10−09
2022−10−10
2022−10−11
2022−10−12
2022−10−13
2022−10−14
2022−10−15
12am 6am 12pm 6pm 12am
13-year-old female
App Categories
Art and Photos
Browser
Calls
Messaging
Gaming
Tools
2022−10−14
2022−10−15
2022−10−16
2022−10−17
2022−10−18
2022−10−19
2022−10−20
2022−10−21
2022−10−22
2022−10−23
2022−10−24
2022−10−25
2022−10−26
2022−10−27
12am 6am 12pm 6pm 12am
13-year-old female
19 CONSTANT COMPANION: A WEEK IN THE LIFE OF A YOUNG PERSON'S SMARTPHONE USE © COMMON SENSE MEDIA. ALL RIGHTS RESERVED.
FIGURE 10: Participants with longer daily duration of smartphone use
2022−08−27
2022−08−28
2022−08−29
2022−08−30
2022−08−31
2022−09−01
2022−09−02
2022−09−03
2022−09−04
2022−09−05
2022−09−06
2022−09−07
Art and Photos
Browser
Calls
Education
Entertainment
Email
Gaming
Live Gaming
Music and Audio
Messaging
Shopping
Social Media
Streaming Video
Tools
YouTube
App Categories
12am 6am 12pm 6pm 12am
11-year-old female
2022−11−08
2022−11−09
2022−11−10
2022−11−11
2022−11−12
2022−11−13
2022−11−14
2022−11−15
2022−11−16
App Categories
12am 6am 12pm 6pm 12am
Art and Photos
Browser
Calls
Entertainment
Email
Gaming
Live Gaming
Music and Audio
Messaging
Parent Controls
Reading
Social Media
Tools
YouTube
17-year-old male
CONSTANT COMPANION: A WEEK IN THE LIFE OF A YOUNG PERSON'S SMARTPHONE USE 20© COMMON SENSE MEDIA. ALL RIGHTS RESERVED.
2022−10−13
2022−10−14
2022−10−15
2022−10−16
2022−10−17
2022−10−18
2022−10−19
2022−10−20
2022−10−21
2022−10−22
2022−10−23
2022−10−24
Art and Photos
App Categories
Browser
Calls
Education
Email
Gaming
Health and Fitness
Music and Audio
Messaging
Shopping
Social Media
Tools
YouTube
12am 6am 12pm 6pm 12am
14-year-old male
2022−10−05
2022−10−06
2022−10−07
2022−10−08
2022−10−09
2022−10−10
2022−10−11
2022−10−12
2022−10−13
Art and Photos
App Categories
Browser
Calls
Email
Gaming
Music and Audio
Messaging
Reading
Social Media
Streaming Video
Tools
YouTube
12am 6am 12pm 6pm 12am
12-year-old female
21 CONSTANT COMPANION: A WEEK IN THE LIFE OF A YOUNG PERSON'S SMARTPHONE USE © COMMON SENSE MEDIA. ALL RIGHTS RESERVED.
FIGURE 11. Participants who primarily used social media apps
2022−10−07
2022−10−08
2022−10−09
2022−10−10
2022−10−11
2022−10−12
2022−10−13
2022−10−14
2022−10−15
2022−10−16
Art and Photos
App Categories
Browser
Calls
Education
Email
Music and Audio
Messaging
Parent Controls
Social Media
Streaming Video
Tools
Video Chat
YouTube
12am 6am 12pm 6pm 12am
14-year-old female
2022−09−29
2022−09−30
2022−10−01
2022−10−02
2022−10−03
2022−10−04
2022−10−05
2022−10−06
2022−10−07
2022−10−08
2022−10−09
2022−10−10
2022−10−11
Art and Photos
App Categories
Browser
Calls
Education
Email
Gaming
Health and Fitness
Music and Audio
Messaging
Parent Controls
Shopping
Social Media
Streaming Video
Tools
12am 6am 12pm 6pm 12am
16-year-old female
CONSTANT COMPANION: A WEEK IN THE LIFE OF A YOUNG PERSON'S SMARTPHONE USE 22© COMMON SENSE MEDIA. ALL RIGHTS RESERVED.
2022−09−02
2022−09−03
2022−09−04
2022−09−05
2022−09−06
2022−09−07
2022−09−08
2022−09−09
2022−09−10
2022−09−11
Art and Photos
Browser
Calls
Education
Email
Gaming
Messaging
Social Media
Tools
Art and Photos
App Categories
12am 6am 12pm 6pm 12am
15-year-old female
2022−10−13
2022−10−14
2022−10−15
2022−10−16
2022−10−17
2022−10−18
2022−10−19
2022−10−20
Art and Photos
App Categories
Browser
Email
Gaming
Music and Audio
Messaging
Social Media
Streaming Video
Tools
YouTube
12am 6am 12pm 6pm 12am
12-year-old male
23 CONSTANT COMPANION: A WEEK IN THE LIFE OF A YOUNG PERSON'S SMARTPHONE USE © COMMON SENSE MEDIA. ALL RIGHTS RESERVED.
FIGURE 12: Participants who primarily used mobile games
2022−08−31
2022−09−01
2022−09−02
2022−09−03
2022−09−04
2022−09−05
2022−09−06
2022−09−07
App Categories
Browser
Entertainment
Email
Gaming
Messaging
Social Media
Tools
YouTube
12am 6am 12pm 6pm 12am
11-year-old male
2022−11−12
2022−11−13
2022−11−14
2022−11−15
2022−11−16
2022−11−17
2022−11−18
2022−11−19
2022−11−20
Browser
App Categories
Calls
Gaming
Messaging
Reading
Tools
12am 6am 12pm 6pm 12am
11-year-old male
CONSTANT COMPANION: A WEEK IN THE LIFE OF A YOUNG PERSON'S SMARTPHONE USE 24© COMMON SENSE MEDIA. ALL RIGHTS RESERVED.
Art and Photos
App Categories
Browser
Calls
Entertainment
Email
Gaming
Messaging
Shopping
Social Media
Streaming Video
Tools
Video Chat
YouTube
2022−09−30
2022−10−01
2022−10−02
2022−10−03
2022−10−04
2022−10−05
2022−10−06
2022−10−07
2022−10−08
2022−10−09
2022−10−10
2022−10−11
12am 6am 12pm 6pm 12am
14-year-old female
2022−11−01
2022−11−02
2022−11−03
2022−11−04
2022−11−05
2022−11−06
2022−11−07
2022−11−08
2022−11−09
Art and Photos
Browser
Calls
Gaming
Messaging
Social Media
Tools
YouTube
App Categories
12am 6am 12pm 6pm 12am
11-year-old male
25 CONSTANT COMPANION: A WEEK IN THE LIFE OF A YOUNG PERSON'S SMARTPHONE USE © COMMON SENSE MEDIA. ALL RIGHTS RESERVED.
FIGURE 13: Participants who primarily used YouTube apps
2022−08−26
2022−08−27
2022−08−28
2022−08−29
2022−08−30
2022−08−31
2022−09−01
2022−09−02
2022−09−03
2022−09−04
2022−09−05
2022−09−06
App Categories
Art and Photos
Browser
Calls
Education
Email
Gaming
Music and Audio
Messaging
Tools
Video Chat
YouTube
12am 6am 12pm 6pm 12am
12-year-old female
2022−11−09
2022−11−10
2022−11−11
2022−11−12
2022−11−13
2022−11−14
2022−11−15
2022−11−16
2022−11−17
2022−11−18
2022−11−19
2022−11−20
2022−11−21
2022−11−22
2022−11−23
2022−11−24
2022−11−25
2022−11−26
2022−11−27
App Categories
Art and Photos
Browser
Calls
Entertainment
Email
Gaming
Health and Fitness
Music and Audio
Messaging
Social Media
Streaming Video
Tools
YouTube
12am 6am 12pm 6pm 12am
11-year-old female
CONSTANT COMPANION: A WEEK IN THE LIFE OF A YOUNG PERSON'S SMARTPHONE USE 26© COMMON SENSE MEDIA. ALL RIGHTS RESERVED.
2022−10−06
2022−10−07
2022−10−08
2022−10−09
2022−10−10
2022−10−11
2022−10−12
2022−10−13
2022−10−14
2022−10−15
2022−10−16
2022−10−17
App Categories
Art and Photos
Browser
Entertainment
Email
Gaming
Music and Audio
Messaging
Social Media
Tools
YouTube
12am 6am 12pm 6pm 12am
15-year-old female
2022−10−11
2022−10−12
2022−10−13
2022−10−14
2022−10−15
2022−10−16
2022−10−17
2022−10−18
2022−10−19
App Categories
Art and Photos
Browser
Calls
Entertainment
Email
Gaming
Messaging
Social Media
Streaming Video
Tools
YouTube
12am 6am 12pm 6pm 12am
16-year-old male
27 CONSTANT COMPANION: A WEEK IN THE LIFE OF A YOUNG PERSON'S SMARTPHONE USE © COMMON SENSE MEDIA. ALL RIGHTS RESERVED.
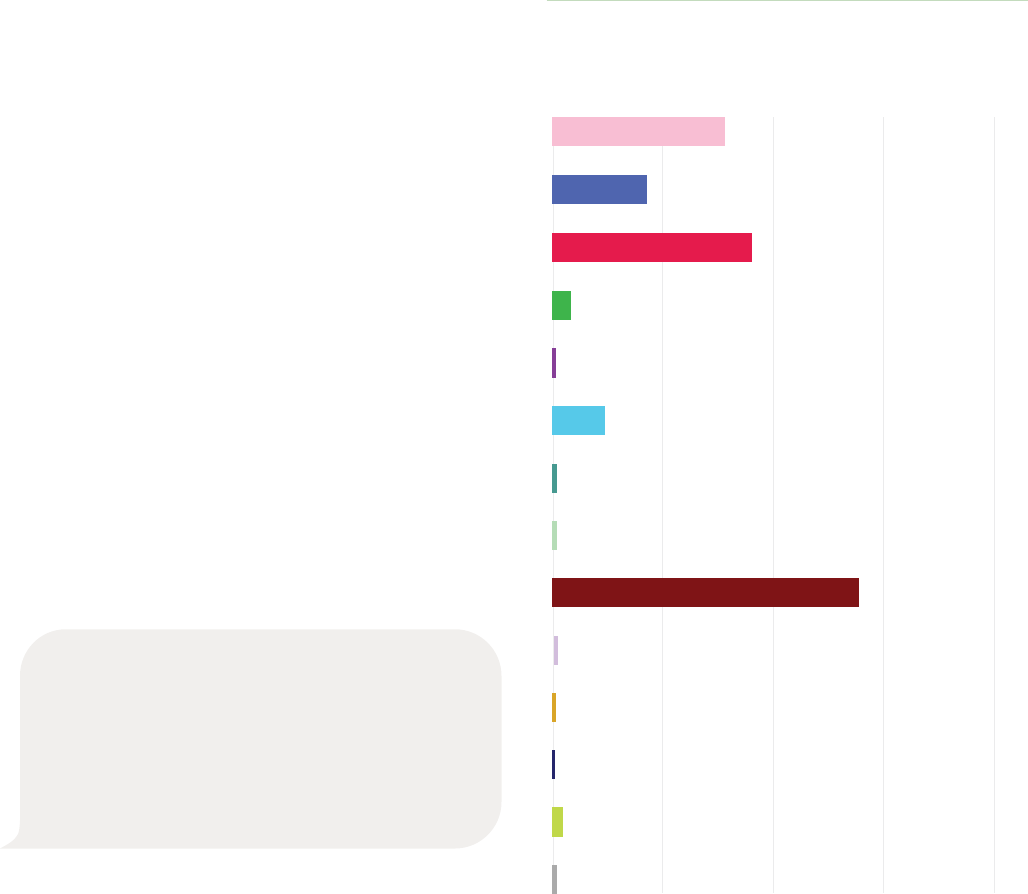
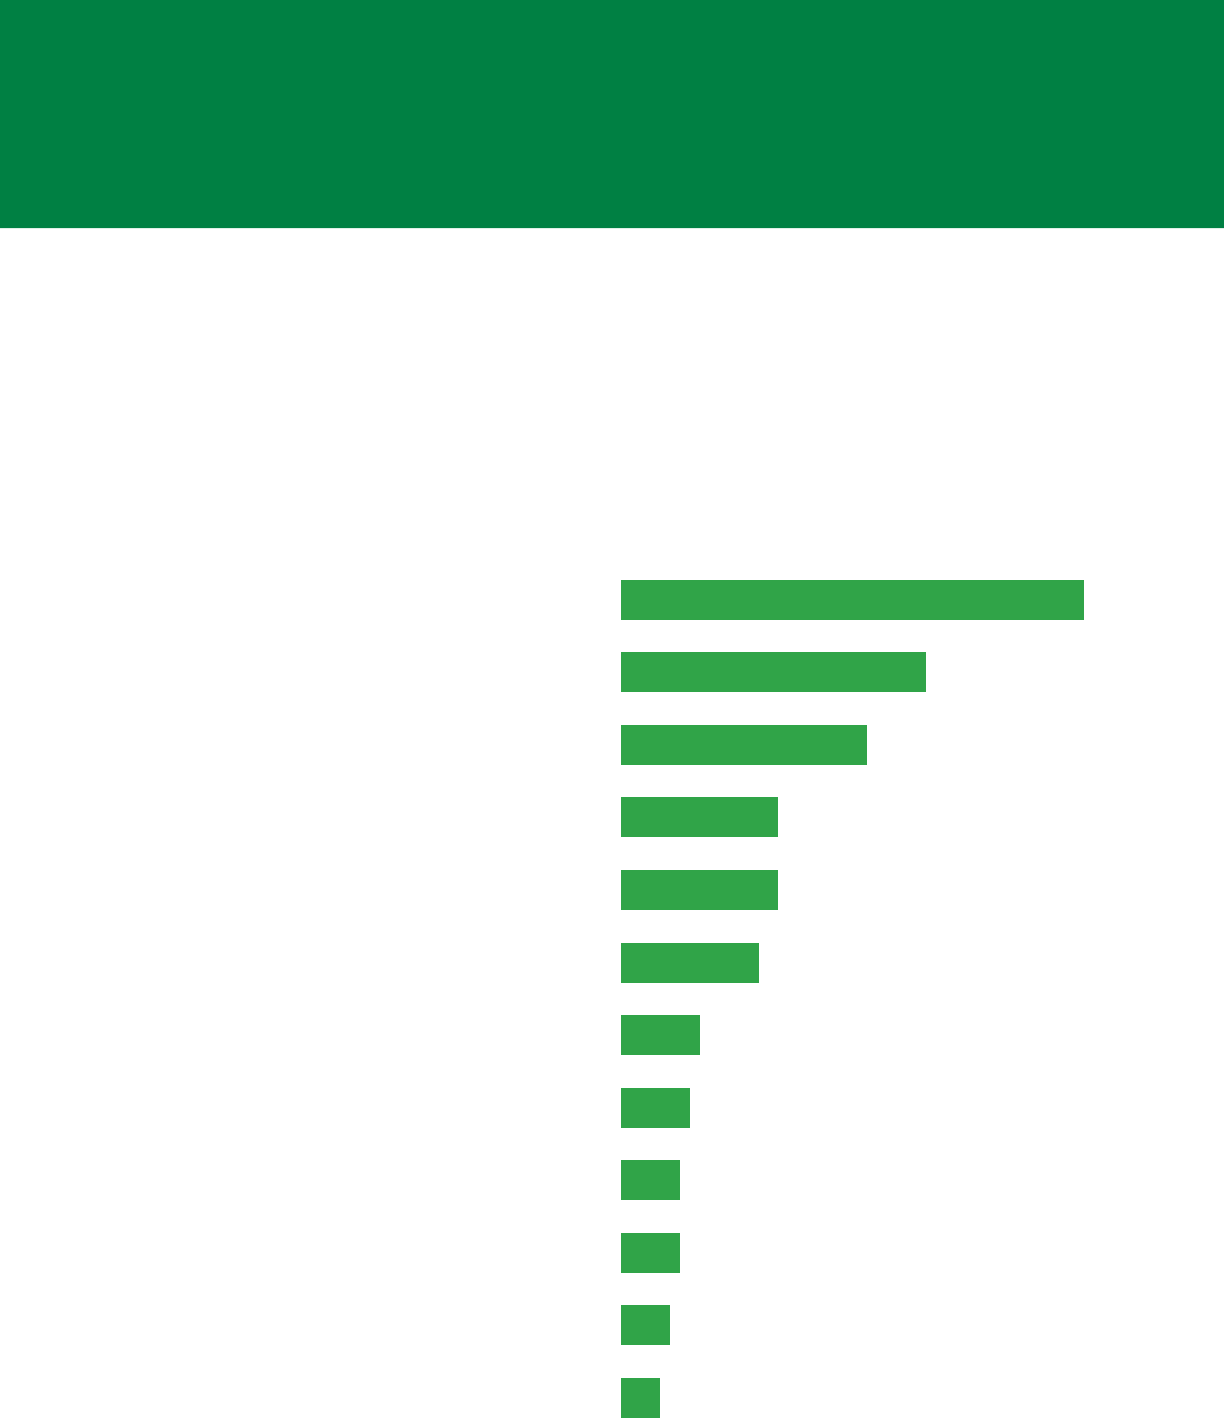
FIGURE 14. Median and IQR* of daily duration of different
app categories**, ranked from longest to shortest duration
*Median is the value that 50% of the users are under and 50% are over. IQR is the
Interquartile Range, which is the middle 50% of users, with 25% of users under the
first value and 25% of users over the second value. Bar shows the median value;
black line shows IQR.
**Includes only participants who used that category of apps.
Which types of apps did participants
use the longest, and why?
While time is often held out as the most important measure of
how young people use their screen-based devices, time is only
one dimension of the smartphone experience. What young
people do, the content they view and the interactions they
have on their smartphones are critical components of how
they use their devices. Research shows that the quality of the
content and types of activities youth engage with online are
more strongly associated with well-being (Popat & Tarrant,
2023). For example, creative and positive social uses of media
are associated with higher well-being, while viewing more
violent or toxic content is linked with more distress. And while
our methodology cannot tell us exactly what content youth
saw on their phones, understanding what types of apps are
used and in what duration gives us a framework to begin to
understand youths' exposure to different types of content.
The 203 participants in our sample used a total of 1,644
unique apps over the week that their smartphones were
tracked. Individual participants used anywhere from five to
125 different apps over the course of the week, averaging
about 40 different apps overall.
When we looked at categories of apps, social media apps were
used for the longest each day, on average, followed by
YouTube (which includes YouTube, YouTube Kids, and YouTube
TV), mobile games, browser, messaging, and streaming video
(see Figure 14). When considered as a proportion of a partici-
pant's overall smartphone usage, social media (42%), YouTube
(19%), and gaming (11%) apps took up the largest percentage
of time per day, among participants who used those apps. In
contrast, despite their popularity, photography/camera apps,
phone calls, and music apps were only used for a few minutes
per day.
Parent Controls (n=48)
Email (n=146)
Education (n=75)
Shopping (n=79)
Calls (n=181)
Reading (n=44)
Music and Audio (n=144)
Art and Photos (n=192)
Streaming Video (n=93)
Messaging (n=193)
Browser (n=200)
Gaming (n=178)
YouTube (n=177)
Social Media (n=153)
Average Daily Minutes (Median [IQR])
75 100 125 150 175 20050250
CONSTANT COMPANION: A WEEK IN THE LIFE OF A YOUNG PERSON'S SMARTPHONE USE 28© COMMON SENSE MEDIA. ALL RIGHTS RESERVED.
Younger participants had the longest duration of the gaming
category of apps. One youth advisor explained the change in
smartphone habits by age this way:
Definitely with more mature teenage audiences,
I feel like there's less game usage ... but I think it
also kind of just depends on who the phone user
is. But I also think that it can be a mix of both.
Like you said, we kind of all get drawn to our
phones when we don't have anything to do, and
definitely I think that social media has kind of
replaced games for older audiences, because it's
like you can pick it up and it's quick entertain-
ment, which is kind of like what a game is, it's
interactive quick entertainment.
—9th grader
This used to apply to me. I'm not active on it
anymore. But the game Hay Day is kind of ... it's
one of the games where you have to come back at
certain intervals to maintain your farm. So I can
see that, like waking up at 8 a.m. and coming back
to it consistently every day, just being integrated
into your schedule because that's how a lot of
people are with it. They know that whenever they
wake up, oh, there's new things to check, you
have to go and maintain your farm, and it's just
like part of their everyday lives.
—11th grader
Over the study week, 657 different mobile games were played
overall, of which 211 (32%) had violent content ratings. When
looking at the mobile gaming patterns found in our partici-
pants, youth advisors found it interesting that some gaming
took place at seemingly random times of day. This was
explained by the fact that some games send notifications to
re-engage the player every day, while other games are
designed in ways that expect frequent engagement to main-
tain progress in the game:
TABLE 2. Popular apps, their number of users, average daily duration, and percentage of total smartphone use they
composed on a typical day*
App name N (%) users
Average daily duration
Median [IQR]**
Range
(hour:minutes)
Percentage of daily use
(median)***
TikTok 102 (50.2%) 1:52 [0:24 - 2:57] <0:01 - 7:48 38.4%
YouTube 175 (86.2%) 0:40 [0:05 - 1:52] <0:01 - 10:13 18.2%
Instagram 70 (34.5%) 0:16 [0:03 - 0:52] <0:01 - 2:56 5.9%
Snapchat 79 (38.9%) 0:10 [0:02 - 0:36] <0:01 - 3:13 3.6%
Discord 72 (35.5%) 0:07 [0:02 - 0:24] <0:01 - 12:20 2.5%
Roblox 74 (36.5%) 0:06 [0:01 - 0:40] <0:01 - 6:25 2.6%
Chrome 191 (94.1%) 0:04 [0:01 - 0:13] <0:01 - 1:24 1.5%
Netflix 53 (26.1%) 0:03 [0:01 - 0:17] <0:01 - 7:31 0.8%
Spotify 81 (39.9%) 0:01 [<0:01 - 0:04] <0:01 - 0:31 0.6%
Facebook 40 (19.7%) 0:01 [<0:01 - 0:04] <0:01 - 1:34 0.1%
Google quick
search box
180 (88.7%) 0:01 [<0:01 - 0:03] <0:01 - 0:21 0.6%
Amazon 47 (23.2%) 0:01 [<0:01 - 0:03] <0:01 - 0:20 0.3%
Pinterest 36 (17.7%) 0:01 [<0:01 - 0:03] <0:01 - 0:48 0.4%
*Calculated only among participants who used that app.
**Median is the value that 50% of the users are under and 50% are over. IQR is the Interquartile Range, which is the middle 50% of users, with 25% of users under the first
value and 25% of users over the second value.
***Percentage of daily use is calculated among those who use the app and as a percentage of all their smartphone use in a day.

29 CONSTANT COMPANION: A WEEK IN THE LIFE OF A YOUNG PERSON'S SMARTPHONE USE © COMMON SENSE MEDIA. ALL RIGHTS RESERVED.
I'd say compared to YouTube, [TikTok] is that you
don't have to search through to find a video that
you wanna watch ... I mean if you're on the
Explorer tab for Instagram, or for YouTube, you
have to kind of decide, but it does it for you. So
you can open the app and instantly have a video
you'll probably like.
—10th grader
It's just you watch a video and it's interesting and
you scroll and it's another interesting video. You
don't even have to find videos on your own, it's
right there, it's customized, and you can share
funny things with your friends, so it's addicting.
—12th grader
TikTok: Teens talk about the ease and capture of
the endless short video scroll
When we asked the youth advisors why their peers scrolled
TikTok for nearly two hours a day, taking up almost 40% of
their total phone time, they had lots to say! While text-based
platforms like Twitter are "more work," TikTok was described
as "so easy" because users can simply open up the app and
videos start to play endlessly, compared to having to "actively"
click on videos. Discussing TikTok, two youth advisors shared:
Apps that dominate time: TikTok and YouTube
Some of the most popular apps used by 11- to 17-year-olds in
our sample are shown in Table 2. Of these, those with the
longest daily duration were TikTok, YouTube, Instagram,
Snapchat, Discord, Roblox, Chrome, and Netflix. (Of note,
although Spotify usually streams music for long periods of
time, it is not recorded by our study app as 'in use' because the
screen is usually off while music streams).
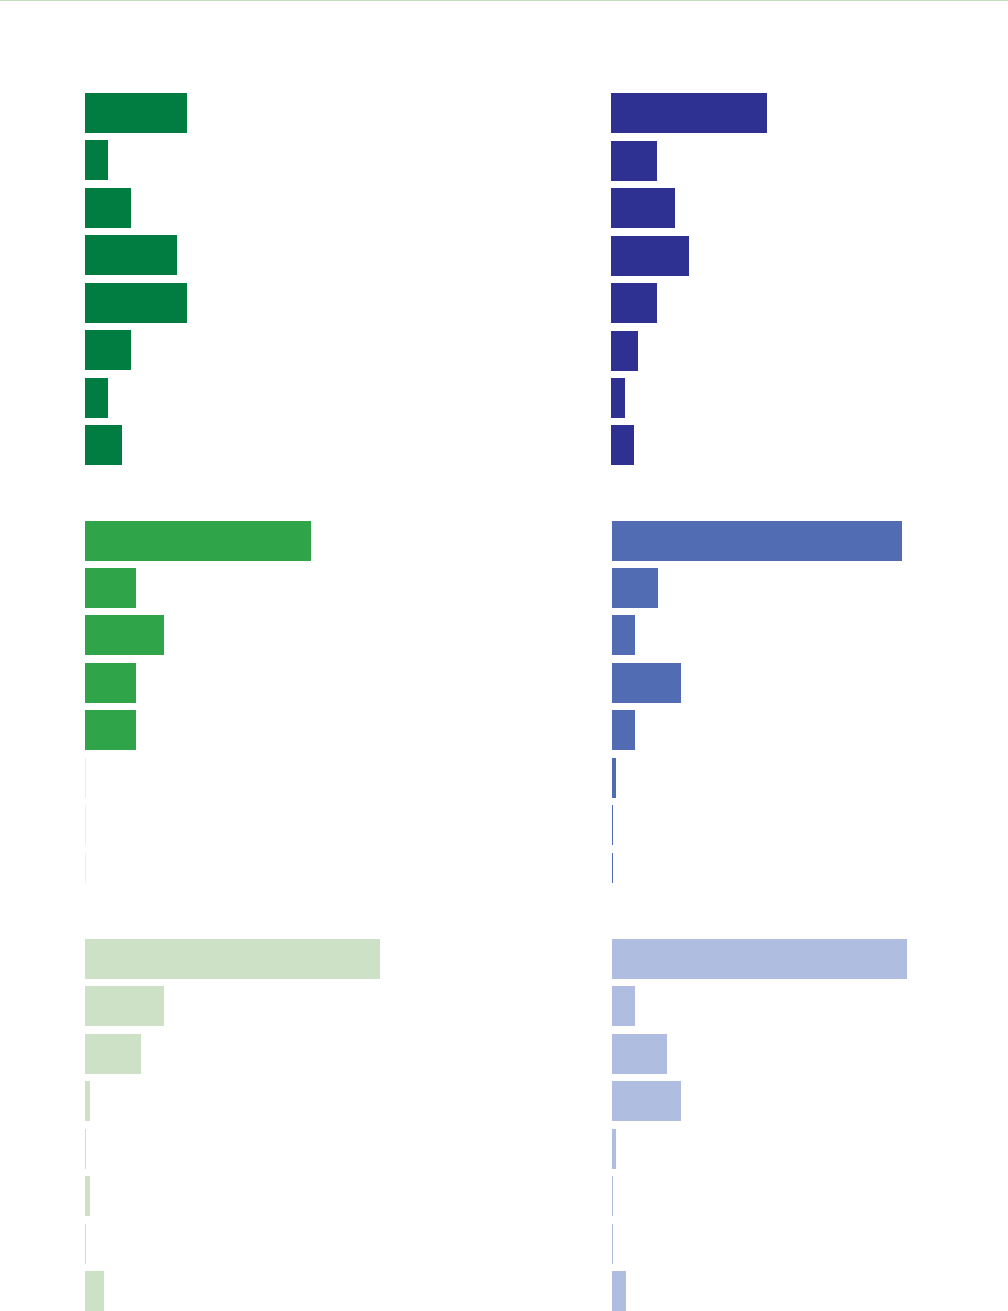
Figure 15 shows the distribution of daily duration of use of the
longest-running popular apps in our sample. TikTok and
YouTube had far more users who spent several hours per day
using these apps, with 64% spending more than an hour/day
on TikTok, and 41% doing the same on YouTube. Our youth
advisors attributed this finding to video length, the friction-
less features of these platforms, and the algorithmic tailoring
of videos to a users' interests, making it difficult to disengage.
In contrast, 22% of Snapchat and 7% of Discord users aver-
aged more than one hour/day on these platforms, which youth
advisors noted are primarily for chatting with friends, so they
are used for briefer snippets of time.
CONSTANT COMPANION: A WEEK IN THE LIFE OF A YOUNG PERSON'S SMARTPHONE USE 30© COMMON SENSE MEDIA. ALL RIGHTS RESERVED.
FIGURE 15. Average daily duration of select popular apps
TikTok (n=102)
5%
10%
22%
20%
10%
5%
22%
8%
4-5 hours
3-4 hours
2-3 hours
1-2 hours
30-60 min
15-30 min
0-15 min
>5 hours
4-5 hours
3-4 hours
2-3 hours
1-2 hours
30-60 min
15-30 min
0-15 min
>5 hours
0%
0%
Discord (n=72)
1%
1%
12%
17%
64%
4%
4-5 hours
3-4 hours
2-3 hours
1-2 hours
30-60 min
15-30 min
0-15 min
>5 hours
YouTube (n=175)
3%
6%
10%
17%
14%
10%
34%
5%
0%
0%
Snapchat (n=79)
1%
5%
15%
5%
10%
63%
4-5 hours
3-4 hours
2-3 hours
1-2 hours
30-60 min
15-30 min
0-15 min
>5 hours
4-5 hours
3-4 hours
2-3 hours
1-2 hours
30-60 min
15-30 min
0-15 min
>5 hours
Instagram (n=70)
0%
0%
11%
11%
17%
11%
49%
0%
4-5 hours
3-4 hours
2-3 hours
1-2 hours
30-60 min
15-30 min
0-15 min
>5 hours
0%
0%
Roblox (n=74)
1%
15%
12%
5%
64%
3%

31 CONSTANT COMPANION: A WEEK IN THE LIFE OF A YOUNG PERSON'S SMARTPHONE USE © COMMON SENSE MEDIA. ALL RIGHTS RESERVED.
Another key piece of TikTok's appeal to teens was that it could
be consumed in small bites of time, such as in between classes,
compared to more "time-consuming" platforms that need a
time or mental investment, such as YouTube or Netflix. They
also noted with TikTok how quickly the algorithm can learn
what they want and shift to meet their current needs.
A lot of people I know are actually defaulting
more to TikTok and social media sites where they
can get kind of like the quick hit of just like a
short video. So I was surprised that some people
spent that much time on YouTube 'cause most
people I know, if they wanna watch video
content, then they'll go to TikTok. You can easily
just scroll past it. But then also, they're just so
short that even if you're not necessarily that
interested, watching it won't really take up that
much time anyway.
—10th grader
Something that usually breaks that chain of
scrolling on Twitter is … I'll see a tweet that I've
already seen before, so I'm like, 'OK, time for
me to get off.' Whereas TikTok there's nothing to
really break that chain of constant new
information and the stimulation … But TikTok
is definitely more of an internal struggle to
actually be like, 'let me get off,' simply 'cause
the content is just so easy to consume, so it just
feels like an urge to continue to keep scrolling.
—11th grader
TikTok is one of the worst forms of it because it's
not much work, you're just scrolling, and also, you
keep on scrolling and you're finding maybe these
things interesting because your feed is accustomed
to you. And it's easy, it's quick, and I feel like that's
also why a lot of our attention spans are getting
much shorter, because even sometimes ... I'm not
on TikTok as much as I used to be, but when I was
really on it, I would find myself skipping videos
that were over 30 seconds because I couldn't ... I
just wanted to keep on scrolling, keep on scrolling.
—11th grader
Automatic advancement of content feeds also contributed to
the "overflowing" experience of using TikTok or YouTube, and
the challenges some teens feel in breaking away from the feed
of videos:
You have to have a bunch of ideas and a bunch of
different videos flowing into your mind and just
that constant flow of information just overflow-
ing, kind of being overwhelming, I feel like, to an
extent. And I feel like for Netflix, though, it's
helpful and it's better in terms of splitting up the
movies you watch because there's that like ... It's
like start the new episode, and then you kinda get
that guilt like, 'Oh, should I start this whole new
episode and waste another 20 minutes, or should
I just go start my homework?' So I feel like that's
why TikTok is so much more time-consuming, and
YouTube as well, because it just never stops.
There's no end… so they all just, I would say, inev-
itably just keep going on and just blend together.
—10th grader
Youth advisors also mentioned how design features like lack
of friction, infinite content, and the short video format influ-
enced their behavior on TikTok:

CONSTANT COMPANION: A WEEK IN THE LIFE OF A YOUNG PERSON'S SMARTPHONE USE 32© COMMON SENSE MEDIA. ALL RIGHTS RESERVED.
Personally, I have one on my TikTok for 45
minutes, but there definitely are some days where
I see it and it's like, 'You have five minutes left for
the day for TikTok,' and I'm like, 'I don't care,' and
I just ignore it. [chuckle] So I think it depends on
how I'm feeling in the day, 'cause sometimes I do
follow that guideline or that restriction, but
sometimes I don't.
—11th grader
I think that most teens don't really follow it, espe-
cially if they set it themselves. It has to be
parent-enforced with a passcode or whatever for
teens to actually follow it. But I feel like, in my
experience, for TikTok, I'm spending two or three
hours a day on TikTok. And I'll set these restric-
tions, yet I'll just block it every time I see it. So I
find it annoying after a while, but I think it's
helpful once I get the notification over and over
to realize that I'm really just wasting my time.
—10th grader
But I also know that YouTube has a sleep notifica-
tion. Like sometimes I get, 'It's time for bed,' and
then you could dismiss it or continue on the app.
—11th grader
We asked youth advisors whether they had tried out time limit
features on TikTok or YouTube, and some had—with mixed
success:
TAKEAWAYS
Time on smartphones among young people is domi-
nated by apps that provide social interaction,
entertaining videos, and games—many of which have
design features that encourage prolonged engage-
ment. These include finely tuned algorithms that can
even adapt to how a child or teen is feeling in the
moment, infinite scrolling of content made by creators
who are competing for attention, and "frictionless"
navigation. (In contrast, a design feature that adds fric-
tion would slow down navigation, cause the user to
pause and make a decision, let them know that they
are "caught up," or encourage them to take a break.)
TikTok in particular was described by our youth advi-
sors as having a lot of engaging ingredients as well as
an ability to be consumed in bite-size bits during down-
time or in between classes. In contrast, apps that
young people use for goal-oriented purposes (such as
taking photos, shopping, or looking something up on a
browser) commanded much less time. Caregivers
should be sensitive to the fact that the companies who
build apps have incentives to design features that
capture kids' attention for longer (such as wanting
more advertising revenue or data collected for tar-
geted marketing), and it's not just kids' lack of
"willpower" that keeps them on their phones.
TALKING POINTS
Adults can ask:
• Which apps take up most of your time (and my
own time, as a parent)? Why is this?
• Are there design features that make your favorite
app hard to put down?
• What do you think social media platforms know
about us, in terms of who we are and how we are
feeling? How do algorithms predict what we
might want to watch or follow?
• How do you see the platform's algorithms at
work? Have you noticed when it's working to
keep you on the app, and how it does that?
• What are some ways to be "in the driver's seat"
while using your phone, other than timers that
don't always work? Are there ways to be con-
scious of the need to not use your phone at
certain times of day? Are there places that you
could keep your phone, some apps that you could
remove, or "do not disturb" settings that could
help you feel more in control?
33 CONSTANT COMPANION: A WEEK IN THE LIFE OF A YOUNG PERSON'S SMARTPHONE USE © COMMON SENSE MEDIA. ALL RIGHTS RESERVED.
App stores have age ratings that
recommend how old the users of
specic apps should be, but these are
not routinely enforced. Age-restricting
"gates" on apps and app stores, such
as entering a birth date, have always
been easy to get through. This means
that it is easy for young smartphone
users to wade (or intentionally jump)
into territory that was not intended
for them. Therefore, we explored
whether our participants appeared
to be accessing age-inappropriate
apps on their smartphones.
NSFK? What we found about participants
using apps intended for older audiences
Under-13s regularly use social media and
age-inappropriate apps
Of 85 participants who were younger than 13, 68% used
social media apps, and they all used at least one app rated
"Teen" or higher. Among 11- to 12-year-olds, the most
popular social platforms were:
Reddit
4%
sendit
5%
BeReal
6%
Twitter
7%
WhatsApp
8%
Pinterest
14%
Facebook
16%
Discord
25%
Snapchat
31%
TikTok
47%
Instagram
16%
Facebook Messenger
6%
CONSTANT COMPANION: A WEEK IN THE LIFE OF A YOUNG PERSON'S SMARTPHONE USE 34© COMMON SENSE MEDIA. ALL RIGHTS RESERVED.
SCREENSHOTS from app store descriptions of social media apps that provide anonymous connections
(L to R: Monkey, TIYA, Obimy, LMK)
Almost half of our participants used apps
with mature/adult age ratings
Use of mature (17+) or adult only (18+) apps was relatively
common, occurring in 45% of participants. These included
Pornhub, fantasy sports/betting apps (Yahoo Fantasy Sports
& Daily, Sleeper Fantasy Football), Telegram, Reddit, Parler,
4chan, casino games, or violent games such as Call of Duty.
Sexy themes show up in some apps,
mostly video games
Of all the apps used by participants in this study,
47 had content flags about sexual themes, nudity,
or suggestive themes, 34 of which were video games.
Use of risky anonymous social platforms
In addition, 14 participants used social media apps with risky
features, like being able to connect with strangers for
messaging, sending photos, or video chat. These included
Obimy (allows random contacts between users), Monkey
(allows users to chat with "new people all over the world"),
TIYA (allows chats with "strangers and friends"), and LMK
(allows instant talking and dropping into audio rooms with
strangers). These apps potentially open child and adolescent
users to unsafe or exploitative interactions with others.
35 CONSTANT COMPANION: A WEEK IN THE LIFE OF A YOUNG PERSON'S SMARTPHONE USE © COMMON SENSE MEDIA. ALL RIGHTS RESERVED.
When I had Discord, it was really, really annoying
with every single message 'cause it wasn't
relevant to me at all, and I just wanted messages
from my friends that I've personally DMed …
there's multiple channels, and if you don't,
I guess, mute certain channels, you will get
every single notification.
—11th grader
I get most excited over Snapchat notifications,
and it doesn't really matter who it's from. I think
that's solely because you get the little Bitmoji,
you get to see who it's from and it's a person
every time, whereas with TikTok or Instagram,
the platform sends you so many just random
notifications that aren't really relevant, there
aren't people interacting with you, that they're
kind of uninteresting.
—11th grader
I know that TikTok, whenever it sends you
notifications, it combines all of them into one.
So if you have a bunch of likes on a post, it won't
send you a notification for each individual one. It
will compile it and it'll be like, 'You have 16 new
notifications,' whereas Snapchat, every time you
get a Snapchat from somebody, it'll give you an
individual message, or every time someone's
typing, you'll get an individual message for that,
and then on top of that, their chat. So those
compile very quickly.
—11th grader
How many smartphone notifications
are young people receiving per day,
and from what apps?
Notifications from apps on our smartphones—whether seen,
heard, felt or silent—are a frequent occurrence for many teen
and adult smartphone users. Compared to smartphone
pickups (see Main Findings section 1), which indicate how
often a user engages with their phone (regardless of whether
they are responding to a notification), notifications signify
how often the phone itself is pinging for attention. These noti-
fications can helpfully direct us to an important message, but
can also serve as a potent distraction from other activities and
draw the user back to their device. Notifications are also one
of the main smartphone design features that users have
control over, which means they can be modified with the goal
of improving focus, family time, or sleep.
Notifications on our participants' smartphones registered in
two ways: notifications delivered and notifications seen by the
user (indicating that they looked at the notification or had
their phone screen on when they received the notification).
On a typical day, participants had a median of 237 notifica-
tions delivered to their smartphone, and they saw or engaged
with 46 of these. This varied considerably between partici-
pants, likely because of the different apps they use, how they
manage notifications, and whether they use "do not disturb"
settings at certain times of day. Notifications were most
numerous from apps young people use to chat with their
friends, such asSnapchat, Instagram, and Discord (see Table 3),
which is consistent with how youth advisors said they priori-
tized their notifications from people they know, rather than
from random platforms, brands, or channels.
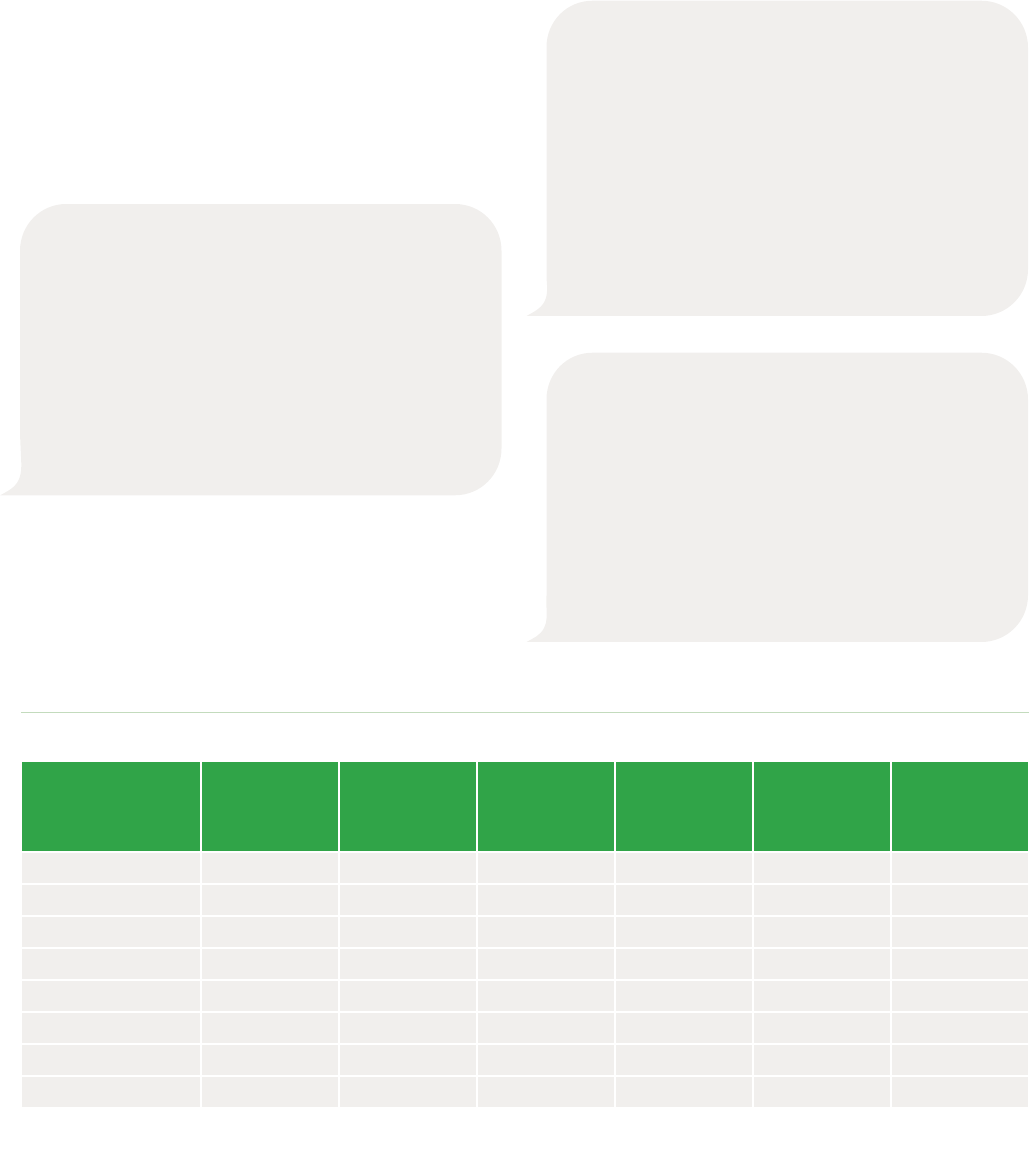
CONSTANT COMPANION: A WEEK IN THE LIFE OF A YOUNG PERSON'S SMARTPHONE USE 36© COMMON SENSE MEDIA. ALL RIGHTS RESERVED.
I think notifications are very annoying. I have
mine off or always on 'do not disturb,' especially
during school, 'cause I feel like after a while, they
just compile and then it's just notification after
notification, and then I can't even see previous
notifications. And then it's just a lot of informa-
tion with just picking up my phone, and it's
almost like the app is trying to get you to get
more involved and go back to the database.
—10th grader
When plotted over the 24 hours in a day (midnight to mid-
night), seen notifications appeared to jump in the morning
hours (possibly when overnight "do not disturb" settings were
disabled or participants first picked up their phones in the
morning) and then peak in the late afternoon/evening. (See
Figures 16 and 17).
Similar to patterns seen with pickups and duration, younger
users (11-12 years) tended to receive and view fewer notifica-
tions than older users (13-15 and 16-17 years).
Youth advisors explained that it is essential to turn off notifi-
cations to reduce the feeling of overload and interruption:
I think it's seen as a way to just re-instill interest
in their app after long periods of time of not being
on it, and it's just a way to keep you engaged with
it, because by sending you so many random
things, it's bound to hit your interest eventually.
But generally, I do think it's annoying [chuckle]
because so many of them are just irrelevant, and I
think that if they sent less of them, it would be a
better way of going about that.
—11th grader
Another thing with notifications, one thing I've
noticed with Instagram is, over time, they keep
adding new, different types of notifications.
Like when they rolled out reels, they had a
notification like, 'Check out the most watched
reels for today.' So over time, you have to keep
turning off those specific notifications because I
still wanna receive messages from my friends
through DMs. I don't wanna receive those kind
of unimportant messages.
—11th grader
They described needing to not just manage the volume of
notifications, but also the proliferation of types of notifica-
tions from different platforms, to keep things in check and
make space for communication with friends.
TABLE 3. Notifications delivered and seen by the most popular apps
App name
N (%)**
who received
notifications
Median [IQR]*
notifications
delivered
per day Range*
N (%)**
who viewed
notifications
Median [IQR]*
notifications
seen per day Range*
Snapchat 78 (39.2%) 19.6 [5.0 - 67.3] 0.1 - 1026.2 75 (37.7%) 8.3 [2.9 - 27.0] 0.2 - 363.6
Discord 59 (29.6%) 11.8 [3.4 - 42.3] 0.1 - 763.7 57 (28.6%) 4.7 [1.6 - 17.9] 0.1 - 491.6
Instagram 70 (35.2%) 8.9 [3.3 - 27.7] 0.2 - 808.6 69 (34.7%) 5.6 [2.0 - 14.6] 0.1 - 121.0
Facebook 37 (18.6%) 4.0 [1.4 - 5.8] 0.1 - 15.4 36 (18.1%) 3.2 [0.8 - 5.0] 0.1 - 7.8
TikTok 79 (39.7%) 2.9 [1.4 - 5.1] 0.1 - 16.1 76 (38.2%) 1.7 [1.0 - 4.3] 0.1 - 13.2
YouTube 141 (70.9%) 2.4 [1.0 - 6.4] 0.1 - 122.2 127 (63.8%) 1.8 [0.7 - 4.3] 0.1 - 90.6
Pinterest 37 (18.6%) 1.9 [1.1 - 2.2] 0.2 - 17.4 36 (18.1%) 1.6 [1.1 - 2.1] 0.1 - 6.1
Roblox 7 (3.5%) 0.2 [0.1 - 1.0] 0.1 - 8.3 5 (2.5%) 0.2 [0.2 - 0.3] 0.1 - 0.3
*Calculated only among participants who received or viewed notifications from that app, respectively.
**Percentage of 199 participants with notification data.
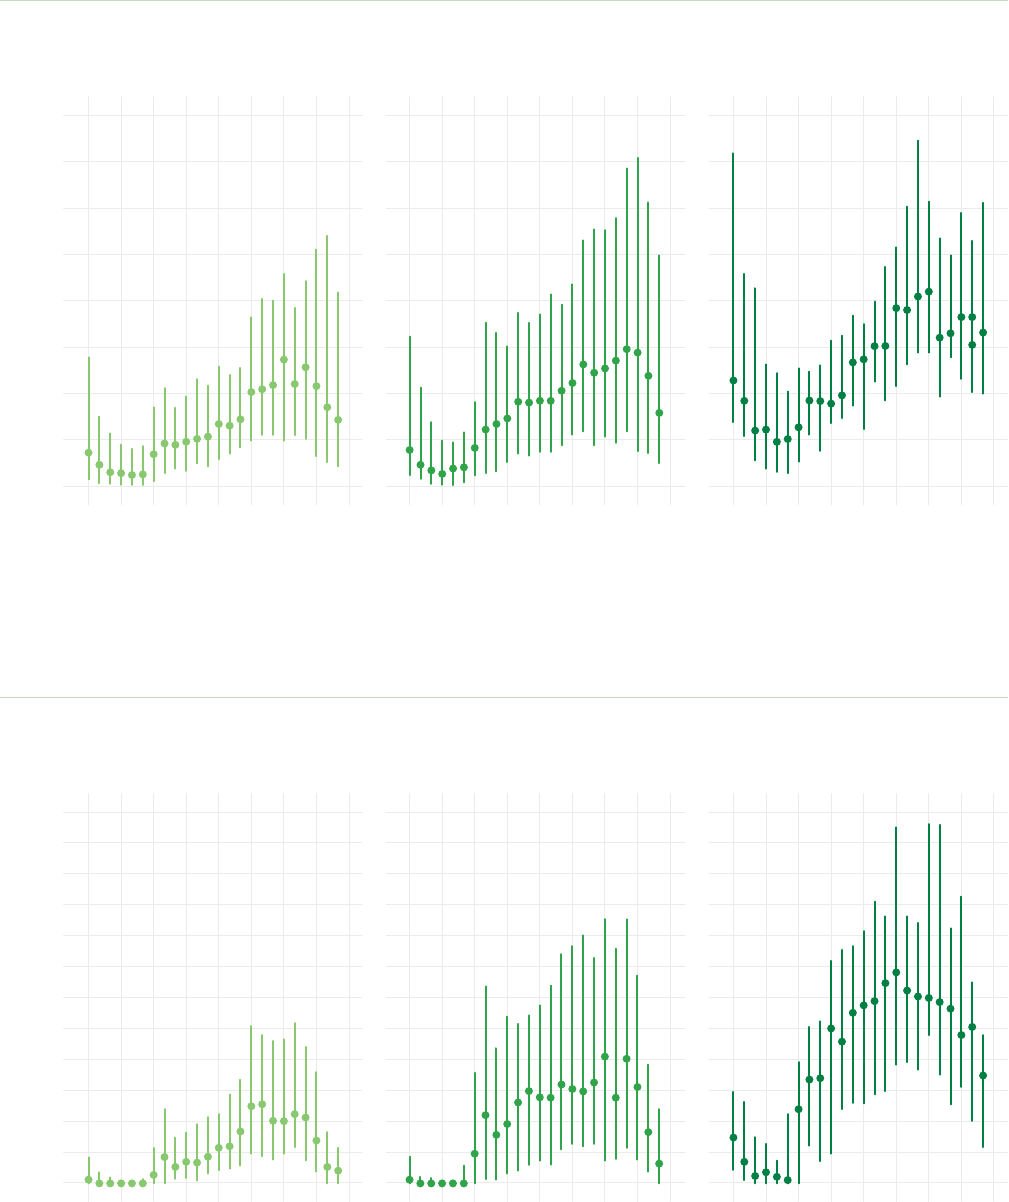
37 CONSTANT COMPANION: A WEEK IN THE LIFE OF A YOUNG PERSON'S SMARTPHONE USE © COMMON SENSE MEDIA. ALL RIGHTS RESERVED.
FIGURE 16. Hour-by-hour plots of average notifications* delivered to participants' smartphones, by age
10
20
30
40
Average Notifications Received [median (IQR)]
0
12am 6am 12pm 6pm 12am 12am 6am 12pm 6pm 12am 12am 6am 12pm 6pm 12am
Time of Day
16-1713-1511−12
*Median is the value that 50% of the users are under and 50% are over. IQR is the Interquartile Range, which is the middle 50% of users, with 25% of users under the first value
and 25% of users over the second value. Dot shows the median value; line shows IQR.
FIGURE 17. Hour-by-hour plots of average notifications* seen or interacted with by participants, by age
Average Notifications Seen (median [IQR])
2
4
6
8
10
12
0
12am 6am 12pm 6pm 12am 12am 6am 12pm 6pm 12am 12am 6am 12pm 6pm 12am
11−12 13-15 16-17
Time of Day
*Median is the value that 50% of the users are under and 50% are over. IQR is the Interquartile Range, which is the middle 50% of users, with 25% of users under the first value
and 25% of users over the second value. Dot shows the median value; line shows IQR.

CONSTANT COMPANION: A WEEK IN THE LIFE OF A YOUNG PERSON'S SMARTPHONE USE 38© COMMON SENSE MEDIA. ALL RIGHTS RESERVED.
TAKEAWAYS
Notifications are plentiful, sometimes fun, sometimes
annoying, and they are one of the main things young
people can control in their smartphones. Notifications
from marketers were the least essential and most
irritating to the adolescents we talked to, who were
also wary of platforms trying to get their attention in
inauthentic ways (e.g., by telling them when a distant
acquaintance had posted but didn't tag them). One of
the main things caregivers and teachers can do is help
young people reflect on how smartphone notifications
affect their emotions, concentration, and habits of
checking their device—and then empower young users
to manage their notifications and set "do not disturb"
times that align with their needs.
TALKING POINTS
What adults can say and do:
• Try looking at settings for screen time and digital
wellness on your phone, and on your child's
phone, to talk about which apps send you the
most notifications.
• Then discuss how to intentionally update the set-
tings (both within apps and in phone notification
settings) to cut out all of the extra disruptions
that young people mention as their biggest
annoyance.
• Although it takes time to do it, stopping to reflect
on how your phone tries to get your attention can
lead to great discussions in families and class-
rooms, and it can give users a feeling of control
over how much they use their smartphone.
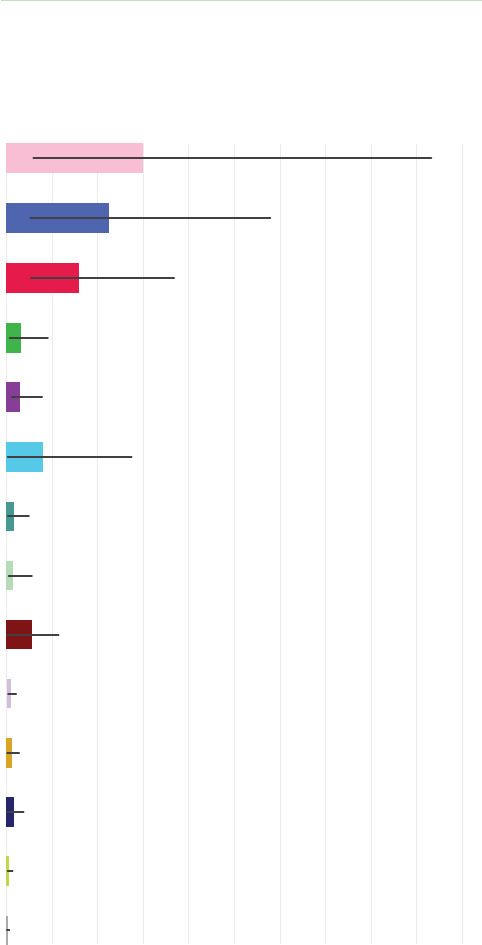
39 CONSTANT COMPANION: A WEEK IN THE LIFE OF A YOUNG PERSON'S SMARTPHONE USE © COMMON SENSE MEDIA. ALL RIGHTS RESERVED.
Parent Controls (n=19)
Email (n=69)
Education (n=51)
Shopping (n=37)
Calls (n=132)
Reading (n=23)
Music and Audio (n=81)
Art and Photos (n=133)
Streaming Video (n=30)
Messaging (n=146)
Browser (n=150)
Gaming (n=119)
YouTube (n=111)
Social Media (n=126)
Average School Day Minutes (Median [IQR])
50403020100
How much does smartphone use
occur during school hours, and why?
Phone use in school has been a subject of intense public
debate, but for many young people it is a necessity, as their
phones may contain school schedules and allow coordination
with family and friends. It is also a potential source of distrac-
tion or avoidance when school feels stressful.
Among the participants in our study, some degree of smart-
phone usage during school hours (Monday through Friday 8
a.m. to 3 p.m.) was nearly universal, and median use was about
43 minutes/day. Young people handled their phones quite a bit
during the school day with a median of 13 pickups (turning the
screen on) during school hours, ranging from <1 to 229.
Smartphone usage visualizations shown in Figures 10, 11, 12,
and 13 illustrate the variety of patterns of smartphone usage
during school hours. Although messaging and browser app
categories were most frequently used during school hours,
this averaged only a few minutes, while social media (32% of
smartphone usage during school hours), YouTube (26%), and
mobile games (17%) took up the largest proportion of time
during school hours, among participants who used those
types of apps.
Surprisingly, parental control apps sent the highest number of
notifications during school hours, sending a median of nearly
30 notifications to young people, with 70 notifications/school
day at the top end. Other app categories sending the most
notifications during school hours were social media (median
5.6, max 759), messaging (median 3.4, max 158), and browser
(median 4.0, max 403). Notifications seen during school hours
were mostly social media (median 2.7, max 205), messaging
(median 2.0, max 92), and browser (median 1.3, max 159),
which is consistent with the ways youth advisors said they
used their phones during school hours.
FIGURE 18. Median and IQR* of duration of use of different
smartphone app categories during school hours**
*Median is the value that 50% of the users are under and 50% are over. IQR is the
Interquartile Range, which is the middle 50% of users, with 25% of users under the
first value and 25% of users over the second value. Bar shows the median value;
black line shows IQR.
**Includes only participants who used that category of apps during specified time
frame (Aug. 29 onward; holiday dates removed from analysis).

CONSTANT COMPANION: A WEEK IN THE LIFE OF A YOUNG PERSON'S SMARTPHONE USE 40© COMMON SENSE MEDIA. ALL RIGHTS RESERVED.
Definitely at lunch, I could see people using
their phone a lot. But in class, it depends on the
school, but if your school has everyone with
computers, then I think computers. If you're
gonna get distracted doing something, it would
be on computers.
—11th grader
Yeah, it's the same for me, but sometimes if it's
a Friday and it's last period and I'm so drained,
sometimes I go on TikTok for the last 15 minutes
just to get me through it, just 'cause when you're
on TikTok, you lose track of time. So if I'm
scrolling on TikTok for what it feels like five
minutes, it's actually been like 13 minutes,
and I'm like, 'Nice. Now the school day is over.'
—11th grader
School policies and smartphones
School phone policies varied widely among the adolescents
we talked to. For example, some youth advisors described
having a total ban on smartphones in their high schools, with
detentions resulting if students used their phone. In other
schools, youth advisors described having policies that ranged
from no restrictions or class-specific rules, including teachers
encouraging use during class (e.g., to look something up or
participate in class discussions), allowing students to use
phones once they completed in-class assignments, and gener-
ally allowing smartphone access between periods. Some
youth advisors' teachers used strategies such as having stu-
dents put their phone in a bag at the front of class, to avoid it
being a distraction. School policies also varied by the age of
students, with the high school age youth advisors reflecting
back on stricter rules in middle school.
Youth advisors provided insight into why they would use
phones in school, when, and what effect it has on them. Many
described using the phone to take small breaks during lunch or
class, but also noted it could be challenging to keep the phone
use to their preset goals or a minimum:
Sometimes I use my phone just to scroll during
lunch. If I have a free period, like on the rare
occasion that I do have a free period, sometimes
I'll use my phone … but I generally try to avoid
touching my phone during school because I don't
want it to throw me off … the reason why I try not
to touch it at all, 'cause even if I set the boundary
of, 'OK, maybe I'll only be on my phone for a
cumulative of 30 minutes of the school day,' it's
hard to know whether I can actually stick to that
boundary, so I'd rather just not pick it up in the
first place to prevent going over that boundary.
—11th grader
It's just like, 'Don't use it during class.'
—11th grader
It's supposed to be no phone until passing times,
that's like four minutes long, but the reality,
students just use it if they wanna use it. And
teachers will start off saying, 'Don't use it,' but if
students want to use it, who's really gonna stop
them? … Teachers definitely say, 'Put your phones
away,' but students get clever. And also just
because of the phone problem, there's a new rule
where you trade in your phone for the pass to go
to the restroom. 'Cause you spend more time
probably in the bathroom with your phone there.
—12th grader

41 CONSTANT COMPANION: A WEEK IN THE LIFE OF A YOUNG PERSON'S SMARTPHONE USE © COMMON SENSE MEDIA. ALL RIGHTS RESERVED.
I played spring sports, so being able to check my
phone and make sure if we weren't sure about the
weather and knowing whether or not the game is
happening or where we were meeting, that was
really helpful. It's harder to check on my com-
puter than it is on a phone. Not me personally, but
there's definitely kids who listen to music during
class or during lunch instead of interacting with
other kids. So I think that would be an area in
which it's not helpful … [this is driven by] I think
either stress or boredom, generally boredom.
—10th grader
I think for school, using it just for communication,
like just texting friends to meet up sometime
during lunch or something, that's definitely
useful. But then when it becomes distracting,
getting a lot of notifications in class and stuff, it
can become a problem.
—11th grader
We have a no-phone rule, and if it's out, the deans
and our teachers are pretty harsh about giving us
detentions. So I think that mostly keeps our
phones away, but I would definitely say in class if
we're just ... If I'm done with an assignment, my
phone will be in my backpack and I'll tap the
screen to see if there's any notifications. And
obviously it's kind of pointless because it's like,
OK, well, you can't actually open those notifica-
tions, but it's just like seeing what's there, and I
think that's kind of the addicting part of it … But
yeah, I would say I think the rules kind of help us,
and I personally am OK with it, yeah. And I think
most of my friends would agree too.
—9th grader
Use during school hours was predominantly social
media apps, which youth advisors said is consistent
with their experience of enjoying checking in with
friends, coordinating meeting up, and getting small
doses of fun. However, they also recognized when
phone use becomes too distracting, is an avoidance
strategy, or serves the purpose of relieving boredom.
The inconsistency between different teachers and classroom
expectations can be frustrating to some adolescents, but
stricter rules are sometimes appreciated in retrospect:
Well, generally my school is pretty relaxed. It's
just some teachers that really do not like phones
in their classrooms. And I feel with those teachers
that are really strict on it, I feel like if anything, it
just causes kids to wanna act out even more.
Because now it's not like, 'Oh, I have my phone
out and she's telling me respectfully, like, hey,
could you put this away?' Now it's like this whole
big deal where the kid's like, 'Oh, but it's not fair
that I never get to use my phone.' When I was in
middle school, we had super, super strict [rules
about] phone use, and at the moment I was like,
'Yeah, this is so annoying,' but now, looking back
on it, it actually was a really good thing.
—11th grader
In my school, we tend to have longer passing
periods, or at least they're close enough together
that lots of students will arrive at class and then
check their email on their phone or check
Snapchat in the remaining time they have before
class starts.
—10th grader
CONSTANT COMPANION: A WEEK IN THE LIFE OF A YOUNG PERSON'S SMARTPHONE USE 42© COMMON SENSE MEDIA. ALL RIGHTS RESERVED.
Currently, my school is really lenient about phone
rules and our teachers are OK with us using
laptops or iPads to help us learn, to take down
notes. And we also, at any moment, can just
access our phone, just not doing tests or quizzes
or anything that it's like an assessment …
And even if, sometimes let's say you get bored in
class, if it's just for a few seconds our teachers
allow us to just quickly check our phones, and
then reset and then come back with a better
sense of concentration.
—12th grader
I really don't find having my phone next to me in
class a distraction. If anything, it's just like, oh, I
have my phone there in case I need it. But when I
do use my phone in school, I find that it's either to
look something up because I don't really under-
stand something, or just after I've finished all my
work, just to be able to relax for a little bit … I will
say that I'm at least tapping my phone to see if I
got a notification or just opening it really quickly
to maybe scroll on Instagram while I'm waiting for
the teacher's directions or something like that.
—11th grader
TAKEAWAYS
Smartphone use in schools is not driven only by young
people's interests and behaviors; it is also largely
shaped by school phone policies and how they are
enforced. Phone policies vary by child age. For
example, middle schoolers often have stricter rules
about not using phones in class, while some high
schools allow students more phone use (Tandon et al.,
2020). This is an opportunity for students to learn self-
regulation and intentional (in other words, not
habit-driven) smartphone usage. Since school is one of
the main environments where adolescents interact
with their peers, it makes sense that phones are being
used for that purpose.
TALKING POINTS
What adults can say and do:
• Ask: What are your school's policies for tech use?
How well are those rules enforced by teachers,
and do students follow them? What do you think
are the positive and negative effects of these
policies?
• Adults can help children and adolescents reflect
on how using smartphones in school makes your
brain feel (in terms of emotions, attention, and
thinking), and when it's an avoidance strategy.
• If they don't want to talk about their own phone
use during school, ask about peers' use: When
does your child think that other kids are using
their phones too much, and why?
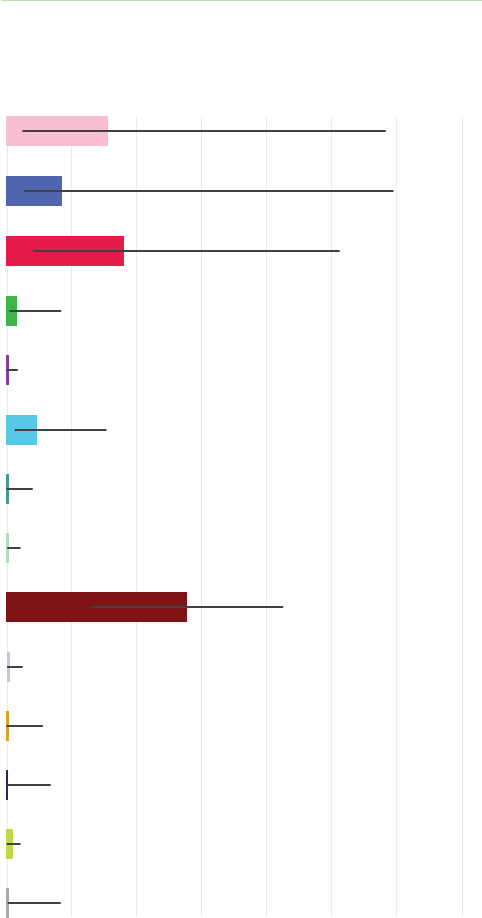
43 CONSTANT COMPANION: A WEEK IN THE LIFE OF A YOUNG PERSON'S SMARTPHONE USE © COMMON SENSE MEDIA. ALL RIGHTS RESERVED.
How much smartphone use occurs
during school night hours, and why?
Sleep is critical for the health and development of children and
adolescents. Concerns and debate over the role of phones and
apps on the sleep habits of teens and tweens have been
ongoing, but studies have rarely looked at the patterns of
smartphone use that occur overnight. We focused specifically
on school nights because insufficient sleep before school can
contribute to feeling unfocused, sleepy, and irritable.
Almost 60% of participants used their smartphone during
school night hours (Monday through Friday, midnight until 5
a.m.) at least once during the study period. Overnight usage
on school nights was shorter (median 19.8, range less than one
minute to 300 minutes) than non-school nights (median 30.3,
range less than one minute to 299 minutes)—typically 20 vs.
30 minutes, respectively. As is illustrated in Figures 9, 10, 11,
12, and 13, social media, gaming, and YouTube were the most
commonly and longest-used app categories during school
night hours. Specific apps seemed particularly engaging over-
night, including mobile games like Nikke, Klondike, Random
Dice, WWE Super Card, or Cat Game. The longest-running
social media app overnight was TikTok.
On a typical school night, the median number of times a teen
or preteen picked up their smartphone was 1.0, ranging up to
18 times in a night. Both notifications delivered and notifica-
tions seen on school nights were relatively sparse, with a
median of less than one per night for most app categories.
Interestingly, the category with one of the highest rates of
notifications overnight was parental control apps (median
15.3 delivered, 0.4 seen, ranging up to 38 delivered and 15
seen per night). This might reflect parental controls pinging
users to tell them they've exceeded bedtime limits.
FIGURE 19. Median and IQR* of duration of use of different
smartphone app categories during school nights**
*Median is the value that 50% of the users are under and 50% are over. IQR is the
Interquartile Range, which is the middle 50% of users, with 25% of users under the
first value and 25% of users over the second value. Bar shows the median value;
black line shows IQR.
**Includes only participants who used that category of apps during specified time
frame (Aug. 29 onward; holiday dates removed from analysis).
Parent Controls (n=3)
Email (n=11)
Education (n=5)
Shopping (n=11)
Call (n=9)
Reading (n=6)
Music and Audio (n=18)
Art and Photos (n=24)
Streaming Video (n=14)
Messaging (n=27)
Browser (n=49)
Gaming (n=32)
YouTube (n=54)
Social Media (n=60)
Average School Night Minutes (Median [IQR])
3020100

CONSTANT COMPANION: A WEEK IN THE LIFE OF A YOUNG PERSON'S SMARTPHONE USE 44© COMMON SENSE MEDIA. ALL RIGHTS RESERVED.
And then, also I think definitely before bed, the
times that show in the night, I think that especially
right before bed, if you're not feeling extremely
tired 'cause you just did a ton of homework, so
you're ready to go, you're feeling productive, I feel
sometimes when you get into bed, you don't
necessarily feel ready to go to sleep. So one of the
things you'll do is just pull out your phone. And I
definitely don't think that's healthy at all, which is
why my parents make me keep my phone
downstairs when I go to bed. But yeah, I would
say that that kind of explains the really late
times of using it.
—9th grader
For me, going on TikTok or something before
I go to sleep, it's like a way for me to procrastinate
actually going to sleep. So now when I go to sleep,
I wake up and then I'm going back to school and it's
back to the stresses of life. But when I'm in bed is
the one time where I really don't have to do
anything, so I'm kind of happy to put off sleeping
if I can just chill for like another hour or something.
—11th grader
Youth advisors thought it was unsurprising that participants
showed this pattern of smartphone use into the overnight
hours, focusing on apps that let them relax and have fun during
what may be their main "downtime." The low frequency of
notifications seen is also consistent with the fact that many
young people put "do not disturb" settings on overnight.
Youth advisors described that time with their phone before
bed might be the only free downtime —their time—that they
have in the day, so they want to use it on something pleasur-
able, like social media or videos/movies.
However, youth advisors endorsed that smartphone use at
night is a mixture of procrastination (because falling asleep
means they have to wake up for the next day, which is school),
losing track of time, and wanting to calm down.
I know that, at least for me, a lot of people
would be still on their phone like at 12 or 1 a.m.
—11th grader
Realistically when you're in school, you can't really
use your phone. When you get home, especially if
you're in middle school or high school, you're
spending hours doing homework, and maybe after-
school stuff. And then when you get home, you're
spending hours doing homework. So I know a lot of
people, especially my age, they will stay up late
because they feel like that's really the only time
that they can be on their phones or that they can
really do anything outside of school. So it's really
not that surprising when you actually think about
it. But initially it is like, 'Oh, yeah, they should be
sleeping,' but it actually does make sense.
—11th grader

45 CONSTANT COMPANION: A WEEK IN THE LIFE OF A YOUNG PERSON'S SMARTPHONE USE © COMMON SENSE MEDIA. ALL RIGHTS RESERVED.
TAKEAWAYS
Phone use at night serves several purposes for young
people, primarily to try to unwind at the end of the day
(something parents use it for too!). However, our
youth advisors felt that social media and video content
is both relaxing and sleep-displacing, and can become
a procrastination strategy. The adolescents we talked
to who reported putting their phone in another room,
using "do not disturb," or other strategies to limit
phone use overnight had less complicated narratives
about phone use at night. In addition to using strate-
gies to keep phones quiet at night, it's also important
to understand how much pressure young people feel
during the day, and give them time to decompress with
or without technology, so they are not packing this
into the end of the day.
TALKING POINTS
What adults can do and say:
• If your child is using their phone a lot at the end of
the day, talk with them about what the rest of
their day looks like: Are they getting enough time
to relax and unwind? Are they overscheduled or
having difficulty finishing homework? Strategize
on how to help de-stress the other parts of their
day first.
• If your child finds it hard to separate from their
phone at night, talk about what types of apps or
content "wake their brain up" versus help them
let go and calm down, and try to only use the
calmer apps before bed.
• Our youth advisors told us that timers and limits
aren't always effective, but they can remind you
that you've spent more time on an app than you
intended, so they're worth a try for kids who feel
like they're wasting time watching videos or
reading other people's posts.
• Experiment with a few nights of using the "do not
disturb" settings, or putting the phone in another
room overnight (for parents, too). Reflect with
your child the next day about how it felt.
I definitely would stay up very late most nights
if I was on YouTube or Instagram. I've caught
myself like, 'Oh, it's already an hour past when I
was planning to go to bed, and I'm just there on
my phone on Instagram.' … Reading or
entertainment or calls…would probably go a lot
less late because I feel like that's not keeping
you glued to the screen.
—10th grader
Youth advisors also recognized the way different apps' design
affordances influence their ability to fall asleep, although this
might vary between adolescents:
I think that's the case with social media,
but not with YouTube. I often watch YouTube right
before I fall asleep and it doesn't cause any
problems for me. It helps me fall asleep, actually.
So that's one way it could be helpful. TikTok, I
think for everybody at least, is just a bunch of
videos over and over again, so a lot of information
coming in at once, as well as a variety of colors and
flashing lights in a sense. And then what I like to do
on YouTube is listen or watch long video essays
that are a couple of hours long and I'll just put that
on and I'll fall asleep to it and I won't even look at
the screen. So I think that helps, in a sense,
not keep me up.
—10th grader
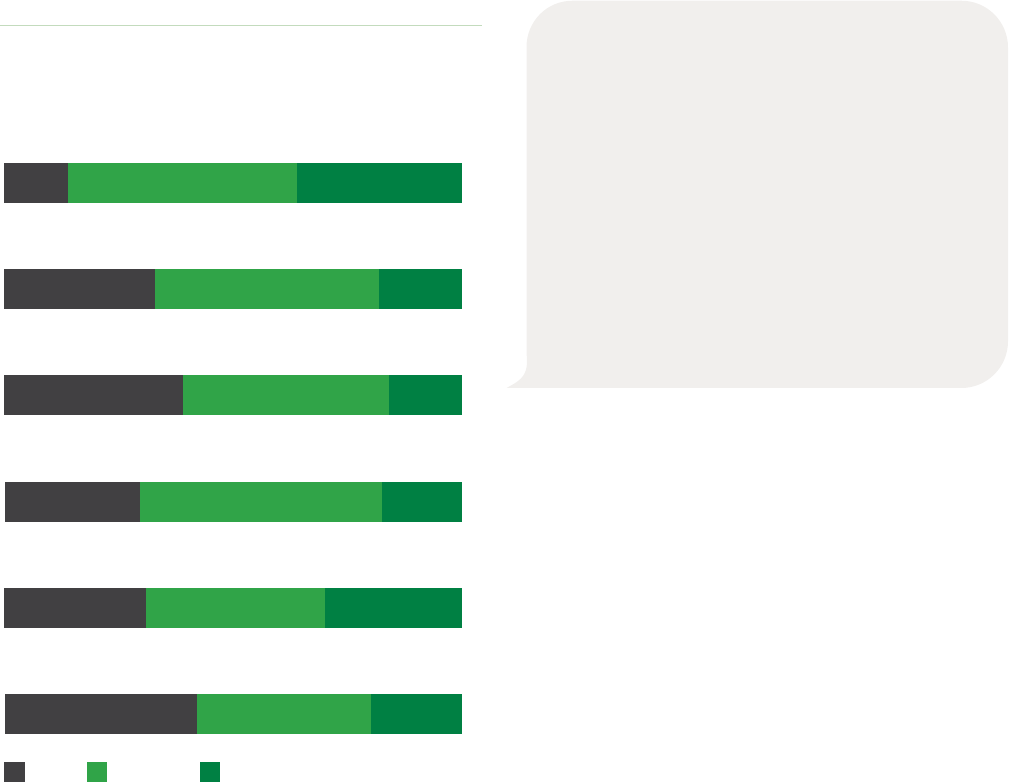
CONSTANT COMPANION: A WEEK IN THE LIFE OF A YOUNG PERSON'S SMARTPHONE USE 46© COMMON SENSE MEDIA. ALL RIGHTS RESERVED.
Because you're with 10- to 12-year-olds who
maybe just got their first phone and that's all that
they wanna do, that's all they wanna use, and
they don't really have as much self-control.
Because it does ... Your relationship with your
phone changes. As you grow older, you realize
like, hey, there's a time and a place, and right now
isn't that place. So I feel like now that I'm in high
school and they kind of ... It's your decision. If you
wanna be on your phone while they're teaching a
lesson, that reflects on you. You know what I
mean? And so I feel like it's also something
that comes with age.
—11th grader
How much tension or frustration
are preadolescents and adolescents
experiencing about their smart-
phones? How do they manage this,
and what does it mean for how
phones could be designed better?
Prior research shows that young people have complicated
relationships with their phones, and often need to put in effort
to feel positive and balanced with the rest of their lives. Based
on responses of our 203 participants to the Technology
Impairment Scale in the survey portion of our study, we found
that the majority endorsed "sometimes" or "often" using tech-
nology in ways that interfered with socializing in person,
getting enough sleep, disengaging from media when they
wanted to, or following through on chores (Figure 20).
FIGURE 20. Self-reported technology management
challenges of 203 11- to 17-year-olds
42%
38% 20%
Do you choose to spend more time online
over going out with others?
31% 39% 30%
Do you use technology to escape from your sorrow
or get relief from negative feelings?
30% 53% 18%
Do you feel restless, frustrated, or irritated when you cannot
access the internet or check your mobile phone?
39% 45% 16%
Do you neglect your daily obligations (school or family life)
because you are using technology?
33% 49% 18%
Are you short of sleep due to being on your phone
or the internet late at night?
14% 50% 36%
Do you find it difficult to stop using technology such as
the internet or your mobile phone, once you start?
Never Sometimes Often
Surprisingly, about one-fifth to one-third of participants
endorsed feeling like technology was getting in the way of
other things "often." Thirty-six percent of participants
reported they often find it difficult to stop using technology
once they have started; 30% reported often using it to escape
from sorrow or get relief from negative feelings; 18% reported
often being short of sleep due to being on their phone or the
internet late at night; 18% reported often feeling restless,
frustrated, or irritated when they could not access the inter-
net or check their phone; 20% reported often choosing to
spend more time online rather than going out with others; and
16% often neglected daily obligations such as school or family
life due to using technology. These technology impairment
reports increased as participants got older.
Youth advisors told us that their relationship with their smart-
phone evolved with age, based on experience, trial and error,
spending more time on their phone, and their growing reflec-
tion and self-awareness:

47 CONSTANT COMPANION: A WEEK IN THE LIFE OF A YOUNG PERSON'S SMARTPHONE USE © COMMON SENSE MEDIA. ALL RIGHTS RESERVED.
Well, one thing that I've changed this year is for
text message notifications. I used to have it so
that when I open my phone, it shows the actual
message, but now I have it so that it just has two
notifications because it makes it a little bit less
tempting to click on it and a little bit easier
to say, 'OK, I'll look at this later.'
—10th grader
I also have 'do not disturb' on, occasionally, but for
the most part I just manually go into settings and
turn off any apps that I think don't really require
notifications. Like what [another Youth Advisory
Council member] said, Spotify or any fitness apps.
I don't work out often so I don't really need it. For
social media apps and just texting and stuff, my
phone is always on vibrate. And I don't really text
people much besides like immediate family and a
few close friends. So besides that, I get maybe just
a hundred notifications per day, which I think is a
healthy amount. For apps, like gaming apps on my
phone, I don't really play games on my phone,
it's just too small for me. And I feel like that really
helps me just concentrate and focus on just
talking to a few friends and family rather than
playing around and receiving like a thousand
notifications per day.
—12th grader
They also talked about adding friction to their phone use at
times of day when they want to resist the urge to check
notifications:
They also describe needing strategies to feel like they are in
control of their phone use, and not vice versa. These primarily
focused on curation of what apps they use and send them
notifications:
I think if you're an active user of your phone,
there's so many notifications you're gonna get
from different platforms that you're not even
using, they're not even just for communication.
You're just gonna get so many that if you don't
curate, you're gonna be overwhelmed.
—11th grader
I always keep my phone on 'do not disturb' at
night, just so that I'm not tempted to go on my
phone, but I also don't keep it in my bedroom.
—9th grader
Yeah, I do, sometimes when I'm asleep, I have
'do not disturb' on, and I usually also put it on
airplane mode. Sometimes if I just wanna stop
any sort of interaction with my phone, I'll just
put on airplane mode.
—10th grader
CONSTANT COMPANION: A WEEK IN THE LIFE OF A YOUNG PERSON'S SMARTPHONE USE 48© COMMON SENSE MEDIA. ALL RIGHTS RESERVED.
When I'm doing homework, what I do a lot
to avoid going on my phone is I set ... I had this
app, and it's like ... I don't know. It's like growing
a plant, so like the time that you put your phone
down and you don't touch it and you don't open
up your phone, the plant grows, so it's like a
little incentive.
—10th grader
For me, my parents were concerned about my
phone usage time for a while, but any time they
tried to put the restriction, it didn't really work out
that well. But when I put on my own restrictions,
they lasted a lot or they have been lasting a lot
longer and actually worked … I think, in a sense,
my parents being really into it was a little bit coun-
teractive because it made me less willing to do it
'cause I felt like I didn't want them to take away my
phone really, and I just used it more. And then
when ... The further we got out from COVID, I real-
ized how much time I was spending on my phone
and that I think I could have come to a little sooner
if I didn't feel the need to go against my parents.
—10th grader
Youth advisors reflected on how limits placed by outside
forces, such as a screen time notification or parent rules, were
less effective than students' own self-motivated strategies:
CONSTANT COMPANION: A WEEK IN THE LIFE OF A YOUNG PERSON'S SMARTPHONE USE 50© COMMON SENSE MEDIA. ALL RIGHTS RESERVED.
From a research perspective, our results are consistent with
other published research in terms of the amount of time that
adolescents self-report spending on social media (Rideout,
2022). App tracking also provides insights into the times of day
when phones are used and notifications are delivered. The
adolescents we interviewed pointed out that the most signifi-
cant limitation of app tracking is that it doesn't tell researchers
what type of content the participant is seeing, what they are
posting, or how they are engaging with others. One focus
group participant said, "Although some people can be on the
same app for the same amount of time in a day, they can be on
completely different sides of the apps and consuming differ-
ent types of content and just utilizing the apps in different
ways." Therefore, future research will need to supplement this
method with either screenshots (e.g., citizen science-type
sampling) or youth self-reporting about what they encoun-
tered on different platforms and how it made them feel.
Another limitation is that app usage statistics are currently
available only from Android devices. However, because
Android device users tend to be from lower socioeconomic
strata than iPhone users (e.g., see Radesky et al., 2020), this
allowed us to enroll a more diverse sample.
Recommendations for parents and caregivers
Specific talking points and conversation starters are described
in the prior sections, but they all involve a few important
concepts:
1. It can be challenging to strike a positive balance between
smartphone usage and the other parts of life that matter
to tweens and teens. Rather than jump to judgment or
frustration, adults should be curious about their experi-
ences to meet them where they are.
2. Kids are often worried that parents will take away their
phones if they reveal negative experiences. Let your child
know at the outset that they can tell you about anything
that happens on their phone and you'll help them through it.
3. Parents themselves use smartphones for several hours
per day, and sometimes the same apps that kids use. Use
this as a way to reflect, exchange experiences, or experi-
ment with changes in phone use to consider how it
changes your mood, concentration, and sleep.
Discussion
Children's smartphone use is a common source of frustration
for adults. We worry that kids are spending too much time, too
much attention, and are being exposed to too many negative
things through these handheld computers that burst into our
lives 15 years ago. However, as adults, we also need to recog-
nize that this generation of young people haven't been given
other technological options (aside from flip phones) to carry
out the developmentally appropriate task of connecting with
their peers, exploring their identities, and learning about the
world independently. The device that's available to them is
also a potent marketing vehicle that tries to keep them
engaged and profile their interests.
In this study, we have explored this topic by combining insights
from the usage data of 203 young people's smartphones with
the narratives of youth advisors. Our goal is not to add to the
debate about when children or teens should get smartphones,
but instead to see the issue from the perspective of how
smartphones shape the experiences of young people. Without
understanding how young people build relationships with
these technologies that contain their friendships, entertain-
ment, stress relievers, and distractions—and how this depends
upon design features of the phones themselves—we will not
be able to support their healthy technology use.
Therefore, our takeaways and recommendations for caregiv-
ers and teachers revolve around supporting, scaffolding, and
building insight around young people's smartphone use,
rather than judging them. We do kids and their digital well-
being a disservice by being overly negative and prescriptive,
since this will likely only shut down conversations and make
young people feel that they cannot come to us when they
experience phone-related challenges—which most do, at one
time or another.
In addition, our recommendations are focused on the smart-
phone manufacturers, operating systems, platforms, and apps
that make up kids' digital ecosystems. There is clear room for
improvement when apps are pinging for attention during the
school day; when teens can access pornography sites, sports
betting, or other apps rated as "Adult"; and given that the
majority of 11- to 12-year-olds in our sample broke through
social media age gates.
51 CONSTANT COMPANION: A WEEK IN THE LIFE OF A YOUNG PERSON'S SMARTPHONE USE © COMMON SENSE MEDIA. ALL RIGHTS RESERVED.
3. Update operating systems so that they help notify apps,
app stores, and platforms that the user is a child or ado-
lescent. This way, apps and stores can use responsible
settings that don't recommend risky content or apps.
4. Mobile carriers should make more affordable, intermedi-
ate device options available to families when they want to
get a phone that is more than a flip phone, but not a full-
access smartphone. Phone models are being introduced
that might serve kids better at different developmental
stages, but they are often expensive or not compatible
with various phone plans.
5. Currently, digital wellness options include timers, lock-
outs, and "do not disturb" settings, which have variable
effectiveness according to the adolescents we inter-
viewed. Some young users have developed approaches
like adding friction or avoiding certain content during
evening hours, but this is far from universal. In fact, two-
thirds of our sample felt their phone use impinged upon
important parts of their life like sleep or emotional
coping. Youth-centered co-design of smartphone options
with adolescents would move the burden away from indi-
vidual children and onto the digital ecosystem around
them. Such an approach would benefit our population as
a whole (Frieden, 2010).
4. Every child is different, and their use of phones and social
media will reflect that individuality. Understanding and
accepting your child's unique way of living in the world is
a big part of understanding and communicating about
their phone use.
5. Installing parental controls, filters, timers, and other
device restrictions is the main option that lots of parents
have for monitoring their child's phone use, but these are
blunt tools that require a lot of upkeep and parent
involvement. Most importantly, none of them will tell you
how your child is feeling. Have regular conversations to
understand how they feel about their life online.
Recommendations for industry
We conclude by listing several insights from this research
that could be used to improve the smartphone user experi-
ence for young people. Children and adults are provided the
same options for smartphone models, operating systems,
and app stores, which means that they are subject to the
same business models, content problems, and persuasive
design practices. Not surprisingly, young users are putting in
a lot of work to manage their relationships with smart-
phones. While it is important not to restrict young people's
opportunities to find good content and information through
their phones, device and app design could be improved to
ease this process for young people and their parents. Below
are some actions that companies and product designers
could take to go beyond their current menu offerings of
parental controls and truly bake youth-centered design into
their products:
1. Create user interface and onboarding processes (for
example, when a young user first gets a phone or creates
an account) that easily allow users to set "do not disturb"
times, manage when they want to get notifications and
from whom, and set goals for how much they would like
to use their phone. These settings should not be buried
or need a separate app to install. This sets the norm that
it's important to be intentional about the time and place
when smartphone use does and does not fit daily life.
2. Work with adolescents and families to design ways to
revisit settings and goals regularly, and to adapt as young
users grow, learn about their smartphone habits, and
develop different daily routines and interests. Different
seasons or school years present appropriate times for
prompts and reflection cues that would engage young
users in the process of thinking about smartphone
balance.
CONSTANT COMPANION: A WEEK IN THE LIFE OF A YOUNG PERSON'S SMARTPHONE USE 52© COMMON SENSE MEDIA. ALL RIGHTS RESERVED.
Radesky, J. S., Weeks, H. M., Ball, R., Schaller, A., Yeo, S., Durnez,
J., ... & Barr, R. (2020). Young children's use of smartphones
and tablets. Pediatrics, 146(1). https://doi.org/10.1542/
peds.2019-3518
Radesky, J., Hiniker, A., McLaren, C., Akgun, E., Schaller, A.,
Weeks, H. M., ... & Gearhardt, A. N. (2022). Prevalence and
characteristics of manipulative design in mobile applications
used by children. JAMA Network Open, 5(6),
e2217641-e2217641.
Rideout, V., Peebles, A., Mann, S., & Robb, M. B. (2022). Common
Sense census: Media use by tweens and teens, 2021. San
Francisco, CA: Common Sense.
Tandon, P. S., Zhou, C., Hogan, C. M., & Christakis, D. A. (2020).
Cell phone use policies in U.S. middle and high schools. JAMA
Network Open, 3(5), e205183-e205183.
Vogels, E.A., Gelles-Watnick, R., and Massart, N. (2022) Teens,
Social Media and Technology 2022, Washington, DC: Pew
Research Center.
Weinstein, E., & James, C. (2022). Behind their screens: What teens
are facing (and adults are missing). MIT Press.
References
5 Rights Foundation (2021). Pathways: How Digital Design Puts
Children at Risk. https://5rightsfoundation.com/uploads/
Pathways-how-digital-design-puts-children-at-risk.pdf
Burnell, K., & Odgers, C. L. (2023). Trajectories of Perceived
Technological Impairment and Psychological Distress in
Adolescents. Journal of Youth and Adolescence, 52(2), 258-
272. https://doi.org/10.1007%2Fs10964-022-01679-1
Francis, Kathleen, et al. Insights about screen-use conflict from
discussions between mothers and pre-adolescents: A the-
matic analysis. International Journal of Environmental Research
and Public Health 18.9(2021): 4686. https://doi.org/10.3390/
ijerph18094686
Frieden, T. R. (2010). A framework for public health action: The
health impact pyramid. American Journal of Public Health,
100(4), 590-595. https://doi.
org/10.2105%2FAJPH.2009.185652
Hiniker, A., Schoenebeck, S. Y., & Kientz, J. A. (2016, February).
Not at the dinner table: Parents' and children's perspectives
on family technology rules. In Proceedings of the 19th ACM
conference on computer-supported cooperative work & social
computing (pp. 1376-1389). https://doi.
org/10.1145/2818048.2819940
Matthes, J., et al. Fighting over smartphones? Parents' excessive
smartphone use, lack of control over children's use, and con-
flict. Computers in Human Behavior 116(2021): 106618.
https://doi.org/10.1016/j.chb.2020.106618
Meerkerk, G. J., Van Den Eijnden, R. J., Vermulst, A. A., &
Garretsen, H. F. (2009). The compulsive internet use scale
(CIUS): Some psychometric properties. Cyberpsychology &
Behavior, 12(1), 1-6. https://doi.org/10.1089/cpb.2008.0181
Moreno, M. A., Kerr, B. R., Jenkins, M., Lam, E., & Malik, F. S.
(2019). Perspectives on smartphone ownership and use by
early adolescents. Journal of Adolescent Health, 64(4), 437-
442. https://doi.org/10.1016/j.jadohealth.2018.08.017
Pew Research Center, (2021): Mobile Fact Sheet: Demographics
of Mobile Device Ownership and Adoption in the United
States, Washington, DC.
Popat, A., & Tarrant, C. (2023). Exploring adolescents' perspec-
tives on social media and mental health and well-being–A
qualitative literature review. Clinical Child Psychology and
Psychiatry, 28(1), 323-337. https://doi.
org/10.1177/13591045221092884
CONSTANT COMPANION: A WEEK IN THE LIFE OF A YOUNG PERSON'S SMARTPHONE USE 54© COMMON SENSE MEDIA. ALL RIGHTS RESERVED.
Supplemental Tables
SUPPLEMENTAL TABLE 1. Select app categories: Average daily duration and percentage of daily use*
App Category N (%) users
Average Daily Minutes
(Median [IQR]**) Range
Percentage of Daily Use
(median)***
Overall 203 (100%) 266.5 [159.5 - 406.9] 2.7 - 976.1 –
Messaging 193 (95.1%) 4.1 [1.6 - 11.5] 0.01 -102.8 1.7%
Calls 181 (89.2%) 1.7 [0.6 - 3.8] 0.004 - 49.0 0.7%
Education 75 (36.9%) 0.8 [0.1 - 2.5] 0.004 - 65.1 0.3%
Video Chat 61 (30.0%) 0.3 [0.01 - 3.6] 0.002 - 136.8 0.1%
Reading 44 (21.7%) 1.8 [0.1 - 8.8] 0.001 - 273.8 0.7%
Art and Photos 192 (94.6%) 2.5 [0.7 - 5.8] 0.002 - 43.1 0.9%
Browser 200 (98.5%) 6.8 [2.2 - 17.3] 0.01 - 611.6 2.7%
Email 146 (71.9%) 0.5 [0.1 - 1.1] 0.002 - 24.1 0.2%
Social Media 153 (75.4%) 91.6 [21.7 - 195.7] 0.01 - 806.4 41.5%
Gaming 178 (87.7%) 25.1 [5.0 - 59.4] 0.002 - 681.2 10.9%
Live Gaming 15 (7.4%) 0.1 [0.01 - 0.3] 0.002 - 5.7 0.01%
YouTube 177 (87.2%) 44.3 [5.6 - 118.1] 0.01 - 613.2 19.3%
Streaming Video 93 (45.8%) 3.9 [0.2 - 18.3] 0.002 - 452.0 1.6%
Music and Audio 144 (70.9%) 2.4 [0.8 - 7.2] 0.002 - 102.6 1.0%
Shopping 79 (38.9%) 1.1 [0.3 - 3.6] 0.01 - 55.6 0.3%
Parent Controls 48 (23.6%) 0.1 [0.1 - 0.4] 0.002 - 47.8 0.1%
News and Magazines 11 (5.4%) 3.6 [0.4 - 7.8] 0.003 - 33.4 2.9%
*Calculated only among participants who used that app category.
**Median is the value that 50% of the users are under and 50% are over. IQR is the Interquartile Range, which is the middle 50% of users, with 25% of users under the first
value and 25% of users over the second value.
***Percentage of daily use is calculated among those who use the app category and as a percentage of all their smartphone use in a day.
55 CONSTANT COMPANION: A WEEK IN THE LIFE OF A YOUNG PERSON'S SMARTPHONE USE © COMMON SENSE MEDIA. ALL RIGHTS RESERVED.
SUPPLEMENTAL TABLE 2. Select app category duration and notification frequency during school hours*
App Category N (%) users**
Median (IQR)
duration of daily
use during
school hours***
Percentage of
school hours use***
Notifications
received
school hours
(median [IQR])****
Notifications
seen
school hours
(median [IQR])****
Overall 187 (96.9%) 42.7 [19.1 - 93.4] – 50.1 [20.2 - 100.4] 12.6 [3.9 - 33.9]
Messaging 146 (75.6%) 1.5 [0.6 - 3.9] 3.8% 3.4 [1.0 - 9.5] 2.0 [0.6 - 5.3]
Calls 132 (68.4%) 0.4 [0.1 - 1.0] 1.1% 1.1 [0.4 - 2.1] 0.5 [0.3 - 1.2]
Education 51 (26.4%) 0.8 [0.1 - 1.9] 1.4% 1.4 [0.6 - 3.2] 1.1 [0.6 - 2.8]
Reading 23 (11.9%) 2.8 [0.1 - 5.7] 3.5% 0.7 [0.4 - 1.1] 0.6 [0.3 - 1.0]
Art and Photos 133 (68.9%) 0.9 [0.2 - 2.5] 1.5% 0.8 [0.4 - 1.7] 0.4 [0.3 - 0.7]
Browser 150 (77.7%) 1.6 [0.4 - 4.5] 3.5% 4.0 [1.9 - 6.0] 1.3 [0.6 - 2.5]
Email 69 (35.8%) 0.3 [0.1 - 0.7] 0.4% 2.4 [0.7 - 7.7] 1.2 [0.5 - 2.8]
Social Media 126 (65.3%) 15.0 [2.9 - 46.6] 32.3% 5.6 [1.5 - 19.0] 2.7 [0.8 - 11.3]
Gaming 119 (61.7%) 8.0 [2.7 - 18.4] 17. 3% 1.3 [0.4 - 2.9] 0.8 [0.3 - 2.3]
YouTube 111 (57.5%) 11.3 [2.6 - 28.9] 25.7% 1.0 [0.5 - 3.4] 1.0 [0.4 - 2.7]
Streaming Video 30 (15.5%) 4.0 [0.1 - 13.7] 5.4% 0.3 [0.2 - 1.0] 0.4 [0.2 - 1.0]
Music and Audio 81 (42.0%) 0.8 [0.2 - 2.8] 1.6% 0.9 [0.5 - 2.4] 0.4 [0.2 - 1.2]
Shopping 37 (19.2%) 0.6 [0.1 - 1.4] 0.6% 1.0 [0.3 - 2.1] 0.8 [0.3 - 1.8]
Parent Controls 19 (9.8%) 0.1 [0.03 - 0.3] 0.2% 29.4 [0.7 - 45.6] 2.0 [0.7 - 5.1]
*For 193 participants enrolled from Aug. 29 on; holiday dates removed from analysis.
**Number (percentage) of participants who used the app category during school hours; this differs from the number of participants who received or viewed notifications.
***Calculated only among participants who used that app category.
****Calculated only among participants who received or viewed notifications from that app category, respectively.
CONSTANT COMPANION: A WEEK IN THE LIFE OF A YOUNG PERSON'S SMARTPHONE USE 56© COMMON SENSE MEDIA. ALL RIGHTS RESERVED.
SUPPLEMENTAL TABLE 3. Select app category duration and notification frequency on school nights*
App Category N (%) users**
Median (IQR)
duration of daily
use during school
night hours***
Percentage of
school night
hours use***
Notifications
received school
night hours
(median [IQR])****
Notifications
seen school
night hours
(median [IQR])****
Overall 114 (59.1%) 19.8 [1.1 - 46.1] – 15.9 [4.7 - 47.6] 2.5 [0.6 - 8.1]
Messaging 27 (14.0%) 0.2 [0.03 - 0.8] 0.9% 0.5 [0.2 - 1.0] 0.3 [0.1 - 0.6]
Calls 9 (4.7%) 0.2 [0.03 - 1.2] 6.0% 0.5 [0.2 - 0.8] 0.4 [0.2 - 0.6]
Education 5 (2.6%) 0.1 [0.1 - 3.3] 0.5% 0.3 [0.2 - 0.5] 0.3 [0.2 - 0.5]
Reading 6 (3.1%) 13.9 [6.4 - 21.2] 18.2% 0.3 [0.2 - 1.0] 0.5 [0.2 - 0.6]
Art and Photos 24 (12.4%) 0.2 [0.1 - 2.0] 0.8% 0.3 [0.2 - 0.6] 0.2 [0.1 - 0.4]
Browser 49 (25.4%) 0.8 [0.3 - 4.2] 4.9% 3.5 [1.6 - 5.3] 0.6 [0.2 - 1.2]
Email 11 (5.7%) 0.5 [0.1 - 1.0] 0.6% 1.2 [0.3 - 4.3] 0.6 [0.3 - 1.0]
Social Media 60 (31.1%) 7.8 [1.3 - 29.1] 38.6% 1.2 [0.4 - 4.9] 1.0 [0.3 - 3.2]
Gaming 32 (16.6%) 9.0 [2.1 - 25.6] 29.0% 0.6 [0.2 - 1.1] 0.5 [0.2 - 1.0]
YouTube 54 (28.0%) 4.3 [1.4 - 29.7] 46.9% 0.8 [0.4 - 1.3] 0.4 [0.2 - 0.9]
Streaming Video 14 (7.3%) 2.4 [0.7 - 7.6] 5.1% 0.3 [0.2 - 0.5] 0.2 [0.2 - 0.3]
Music and Audio 18 (9.3%) 0.2 [0.1 - 1.0] 1.0% 0.8 [0.5 - 2.0] 0.2 [0.1 - 0.4]
Shopping 11 (5.7%) 0.2 [0.04 - 2.7] 0.3% 0.3 [0.1 - 0.5] 0.3 [0.2 - 0.6]
Parent Controls 3 (1.6%) 0.2 [0.1 - 4.1] 9.7% 15.3 [2.3 - 17.0] 0.4 [0.3 - 1.0]
*For 193 participants enrolled from Aug. 29 onward; holiday dates removed from analysis.
**Number (percentage) of participants who used the app category during school night hours; this differs from the number of participants who received or viewed
notifications.
***Calculated only among participants who used that app category.
****Calculated only among participants who received or viewed notifications from that app category, respectively.

© 2023 Common Sense Media. All rights reserved. Common Sense, associated names, associated trademarks,
and logos are trademarks of Common Sense Media, a 501(c)(3) nonprofit organization (FEIN: 41-2024986).
About Common Sense
Common Sense is the nation's leading nonprofit organization
dedicated to improving the lives of all kids and families by providing
the trustworthy information, education, and independent voice
they need to thrive in the 21st century. Our independent research
is designed to provide parents, educators, health organizations,
and policymakers with reliable, independent data on children’s use
of media and technology and the impact it has on their physical,
emotional, social, and intellectual development. For more informa-
tion, visit commonsense.org/research.
commonsense.org
